Firearm Suicide By Congressional District
How does your district stack up?

Introduction
Every year suicide claims more than 45,000 lives in the US1Centers for Disease Control and Prevention. National Center for Health Statistics, Wide-ranging Online Data for Epidemiologic Research (WONDER), Underlying Cause of Death, 2014–2018. roughly the same number of American lives taken in combat during the Vietnam War.2US Department of Veterans Affairs, “America’s Wars,” November 2019, https://bit.ly/3lq9cN6. Suicide is the most common form of violent death in the US and firearms are the most common means of suicide, contributing to half of all suicide deaths.3CDC WONDER, Underlying Cause of Death, 2014–2018. And over the past decade, the situation has intensified: the US firearm suicide rate has increased by 19 percent over this period.4CDC WONDER, 2009 to 2018. Nonfirearm suicides have increased 24 percent over this same period. A gun suicide death occurs in the US every 23 minutes on average.5CDC WONDER, Underlying Cause of Death, 2014–2018. While these statistics paint a distressing picture, suicide is preventable and reducing firearm suicide in particular could save thousands of lives each year.
Survivor Stories
“My brother and I started the summer each year jumping into Lake Michigan on Memorial Day weekend. He was my hero. He was a hero to a lot of other people too. Ben served his country and his community, but his struggles with depression were too great a burden. My brother ended his life with a firearm in July 2006. Now, I take my children to Lake Michigan on Memorial Day weekend, and they jump in the lake, and we talk about the uncle they never got to meet. Red flag legislation could have saved my brother’s life, and it could save the lives of thousands. The painful ripple effects of suicide leave a lasting impact.”
– Mary
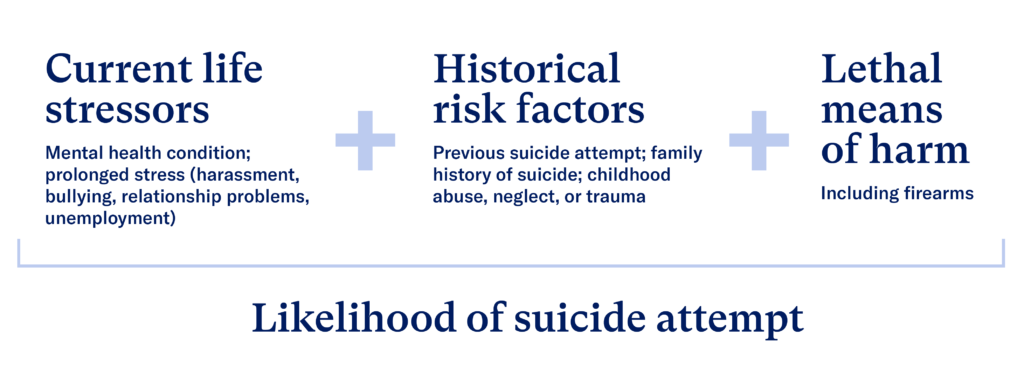
As with any public health crisis of this magnitude, the “cure” requires data and science to figure out the causes of the problem and the interventions that work to prevent it. The dynamics of suicide are complex and there is no one single cause. But research has increasingly confirmed that a combination of several risk factors are often present in the lead up to suicide. These known risk factors are current life stressors—such as relationship problems, unemployment or financial problems, bullying, alcohol and substance use disorders, or mental health conditions—along with historical risk factors—such as childhood abuse or trauma, a previous suicide attempt, or a family history of suicide—and access to lethal means of harm such as firearms.6American Foundation for Suicide Prevention, “Risk Factors and Warning Signs,” accessed August 20, 2020, https://bit.ly/2bmWnQx. Suicide risk greatly increases when these three factors—if ignored—coincide to create a sense of hopelessness and despair.
Out of all these risks, removing access to firearms is the easiest and quickest way to intervene—by keeping guns out of the hands of people experiencing crises.
Figure 1. Risk factors for suicide
While science on the risks, causes, and underlying factors of suicide is advancing, data on suicide lags behind. In the US today, a public health approach to identifying risk factors and taking fast action is hampered by a two-year lag in the availability of suicide data. This data is particularly lacking with regards to vulnerable groups and smaller geographic areas.
The focus of this research is calculating suicide and firearm suicide counts and rates for each congressional district. This is essential for pointing to the types of legislation and local programs that can address this public health crisis in each district.7The importance of presenting mortality by congressional district is not unique to firearm deaths. Analysis of congressional district mortality has similarly been calculated for other causes of death, including cancer, coronavirus, opioid use, and multiple causes of mortality. Congressional districts are a valuable geographic unit for data analysis because they all have roughly the same population size, approximately 740,000 residents.8116th Congress, district borders as elected in 2018. American Community Survey, 5-year, 2014-2018.
Everytown Research has addressed this unmet need for data for America’s 435 congressional districts9Analysis also includes the non-voting congressional district of Washington, DC. by building on existing data from the Centers for Disease Control and Prevention (CDC), the federal agency that publishes suicide and firearm suicide statistics. The Everytown methodology uses data from the CDC, with a focus on variation in suicide rates by sex, race, and ethnicity,10Allison Ertl et al., “Surveillance for Violent Deaths—National Violent Death Reporting System, 32 States, 2016,” Morbidity and Mortality Weekly Report (MMWR) Surveillance Summaries 68, no. 9 (October 4, 2019): 1–36, https://bit.ly/3iEgoTW. combined with demographic data from the US Census Bureau112010 Census Congressional District Summary File for the 116th Congress (Jan. 3, 2019 – Jan. 3, 2021). to calculate both the rates and numbers of suicides and firearm suicides by congressional district. This follows a similar methodology to that used by the American Cancer Society and the CDC for calculating cancer deaths by congressional district.12Centers for Disease Control and Prevention. United States Cancer Statistics. “Congressional District Estimates,” https://bit.ly/3kvr6gd. For further details, see the Methods Note.
Firearm suicide data for congressional districts can help voters and elected representatives pinpoint the scope and location of the problem, help identify underlying factors present in different places, and mobilize communities to take action to save lives.
Key Findings
Over the past five years, there have been an average of nearly 23,000 firearm suicide deaths in the US—a rate of 6.7 per 100,000 people.13CDC WONDER, Underlying Cause of Death, 2014–2018. Boys and men make up 86 percent of these deaths, while girls and women make up the remaining 14 percent.14CDC WONDER, Underlying Cause of Death, 2014–2018. The racial and ethnic differences in the incidences of firearm suicide are also quite pronounced with white people having the highest rates, followed by American Indian and Alaska Native, Black, Latino, and Asian and Pacific Islander people.15CDC WONDER, Underlying Cause of Death, 2014–2018. These differences are discussed further below.
There are 52 firearm suicides on average per congressional district each year, yet there is tremendous district-level variation across the country and even within states (see map 216This cartogram shows each of the 435 congressional districts as approximately the same size. This helps represent their equal political power—one vote—in the House of Representatives despite their enormous variation in square mileage and shape. Congressional district hexmap, v2.1 by Daniel Donner for Daily Kos Elections, https://dkel.ec/map.). Seventeen districts—in Massachusetts, New Jersey, New York and Washington, DC—have 10 or fewer firearm suicides each year. On the other hand, 11 districts—in Alaska, Arizona, Colorado, Idaho, Montana, Oklahoma, Oregon, and Tennessee—have over 100 gun suicides each year.
Map 1. Average annual firearm suicides by congressional district
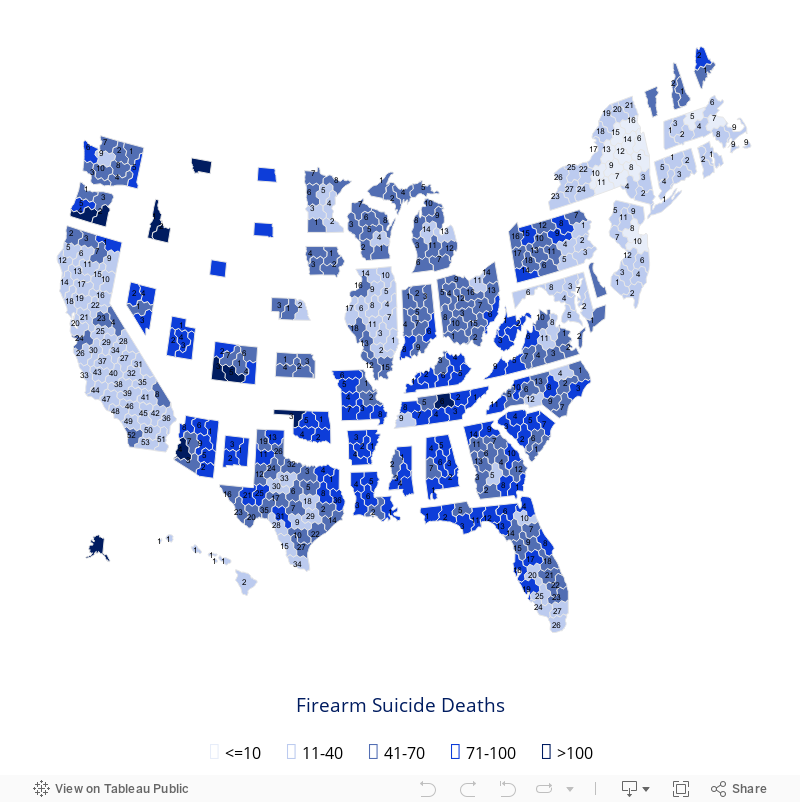
On average, there are 52 firearm suicides per year per congressional district. However…
≤ 10
There are 10 or fewer firearm suicides/year in 17 districts in Massachusetts, New Jersey, New York, and Washington, DC.
100+
There are 100 or more firearm suicides/year in 11 districts in Alaska, Arizona, Colorado, Idaho, Montana, Oklahoma, Oregon, and Tennessee.
Lowest and highest rates of firearm suicide
The 20 congressional districts with the lowest rates of firearm suicide are confined to only three states: Massachusetts, New Jersey, and New York, plus the non-voting District of Columbia (see table 1). In most of these districts, there were fewer than 10 firearm suicides per year. Counts below 10 are suppressed to protect the privacy of individuals in those places. Rates of firearm suicide in these districts are below 2 per 100,000 people. On average, firearm suicides comprise 15 percent of all suicides in these districts, far lower than the national average of 50 percent.
Table 1. Twenty congressional districts with lowest firearm suicide rate
| Firearm suicide rate national rank | State-district | Firearm suicides per year (district average 52) | Firearm suicide rate per 100,000 (district average 7.1) | Firearm suicides as percent of all suicides (district average 50%) | Population (district average 740,603) |
|---|---|---|---|---|---|
| 436 | New York-13 | <10 | <1.5 | <25% | 774,528 |
| 435 | New York-05 | <10 | <1.5 | <25% | 772,342 |
| 434 | New York-15 | <10 | <1.5 | <25% | 744,647 |
| 433 | New York-08 | <10 | <1.5 | <25% | 771,343 |
| 432 | New York-07 | <10 | <1.5 | <25% | 734,208 |
| 431 | New York-09 | <10 | <1.5 | <25% | 733,271 |
| 430 | New York-12 | <10 | <1.5 | <25% | 719,072 |
| 429 | New York-10 | <10 | <1.5 | <25% | 730,760 |
| 428 | New York-14 | <10 | <1.5 | <25% | 705,681 |
| 427 | New York-06 | <10 | <1.5 | <25% | 732,433 |
| 426 | Massachusetts-07 | <10 | <1.5 | <25% | 795,850 |
| 425 | New York-16 | <10 | <1.5 | <25% | 741,586 |
| 424 | New Jersey-10 | <10 | <1.5 | <25% | 749,828 |
| 423 | New York-11 | <10 | <1.5 | <25% | 730,634 |
| 422 | Massachusetts-05 | 10 | 1.3 | 15% | 766,241 |
| 421 | New Jersey-08 | 10 | 1.3 | 21% | 760,952 |
| 420 | District of Columbia-At large | <10 | <1.5 | <25% | 684,498 |
| 419 | New Jersey-09 | 11 | 1.5 | 22% | 751,755 |
| 418 | New Jersey-06 | 11 | 1.5 | 19% | 736,045 |
| 417 | Massachusetts-08 | 12 | 1.5 | 18% | 764,581 |
The 20 congressional districts with the highest rate of firearm suicide are found across 16 states (see table 2), all in the Western and Southern US. In stark contrast to the districts with the lowest rates of firearm suicide, these districts have, on average, 106 firearm suicides per year. The rate of firearm suicide in the 20 districts with the highest rates of firearm suicide is more than 10 times higher than that of the 20 districts with the lowest rates of firearm suicide. Rates of firearm suicide in these districts are all above 13 per 100,000 people. Firearm suicides account for 61 percent of all suicides in these districts—well above the national average of 50 percent.
Table 2. Twenty congressional districts with highest firearm suicide rate
| Firearm suicide rate national rank | State-district | Firearm suicides per year (district average 52) | Firearm suicide rate per 100,000 (district average 7.1) | Firearm suicides as percent of all suicides (district average 50%) | Population (district average 740,603) |
|---|---|---|---|---|---|
| 1 | Arizona-04 | 139 | 18.0 | 63% | 768,077 |
| 2 | Montana-At large | 172 | 16.5 | 63% | 1,041,732 |
| 3 | Wyoming-At large | 93 | 16.1 | 64% | 581,836 |
| 4 | Alaska-At large | 115 | 15.6 | 61% | 738,516 |
| 5 | Colorado-03 | 109 | 14.7 | 56% | 739,107 |
| 6 | Nevada-02 | 99 | 14.0 | 57% | 708,357 |
| 7 | Oregon-02 | 112 | 13.9 | 58% | 805,737 |
| 8 | West Virginia-03 | 81 | 13.7 | 64% | 591,379 |
| 9 | Kentucky-05 | 95 | 13.6 | 73% | 702,070 |
| 10 | Colorado-05 | 106 | 13.5 | 51% | 786,912 |
| 11 | Tennessee-06 | 102 | 13.5 | 65% | 759,176 |
| 12 | Arkansas-01 | 97 | 13.4 | 65% | 722,915 |
| 13 | West Virginia-02 | 83 | 13.4 | 64% | 623,350 |
| 14 | Oregon-04 | 106 | 13.3 | 56% | 794,776 |
| 15 | New Mexico-02 | 92 | 13.2 | 59% | 700,177 |
| 16 | Georgia-09 | 97 | 13.2 | 67% | 735,832 |
| 17 | Idaho-02 | 108 | 13.2 | 59% | 818,249 |
| 18 | Idaho-01 | 114 | 13.1 | 61% | 869,560 |
| 19 | Oklahoma-02 | 98 | 13.1 | 57% | 748,286 |
| 20 | Oklahoma-03 | 101 | 13.0 | 64% | 776,845 |
Variation within states
The surprising variation within states provides additional information that can be vital for focusing suicide prevention efforts on different groups and populations (see table 3).
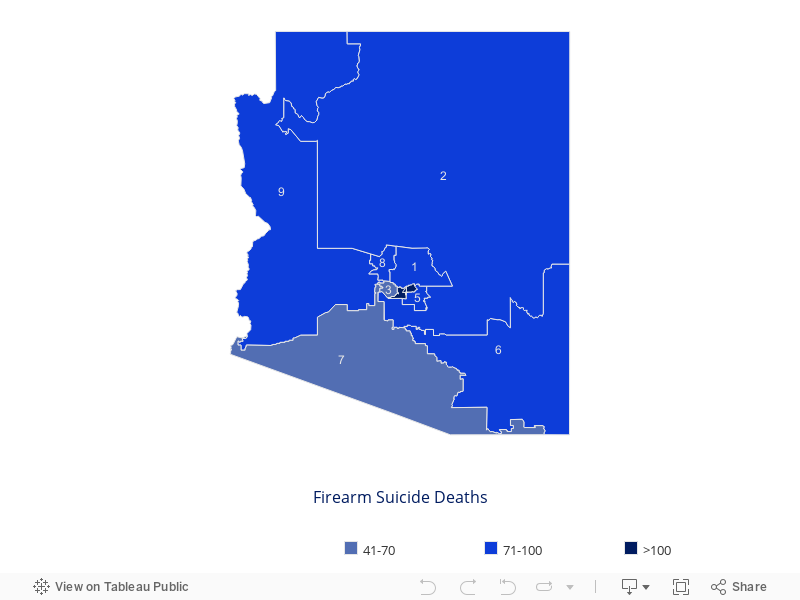
Arizona, for example, has a total of nine congressional districts. District 7, an urban district centered on Phoenix, has 50 firearm suicides annually, just below the national district average. In District 4—which starts on the periphery of Phoenix and makes up much of the rural, western part of the state—there are an average of 139 firearm suicides per year. This is the US district with the highest firearm suicide rate. The population of District 4 is three-fourths white (non-Hispanic), the racial group in the US with the highest rate of firearm suicide. The population of District 7 is one-fifth white (see map 2). Racial and ethnic variation in suicide and firearm suicide rates are discussed further below.
Map 2. Arizona firearm suicide deaths by congressional district
Map 3. California firearm suicide deaths by congressional district
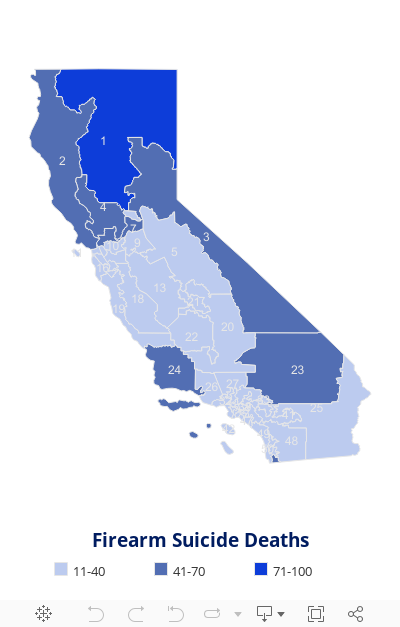
In California, two districts with virtually the same population size have very different outcomes in terms of firearm suicide. California’s District 1, which encompasses a number of rural, northern counties reaching up to the California-Oregon border, has 84 firearm suicides per year, on average. This is well above the national district average of 52. District 40—located in southern California, including parts of Los Angeles County—has an average of 13 firearm suicides annually (see map 3). Rural populations tend to have higher rates of firearm suicide; some discussion on this trend is found below.
Finally, Tennessee, which has nine districts, is also a state with wide variation: from an average of 102 firearm suicides per year in District 6—a rural, farming Middle Tennessee district with small cities and towns—to an average of 38 firearm suicides annually in District 9—an urban district that includes Memphis and the state’s southwestern tip. District 6 and District 9 have very similar population sizes, but firearm suicides are nearly three times higher in District 6 (see map 4).
Map 4. Tennessee firearm suicide deaths by congressional district
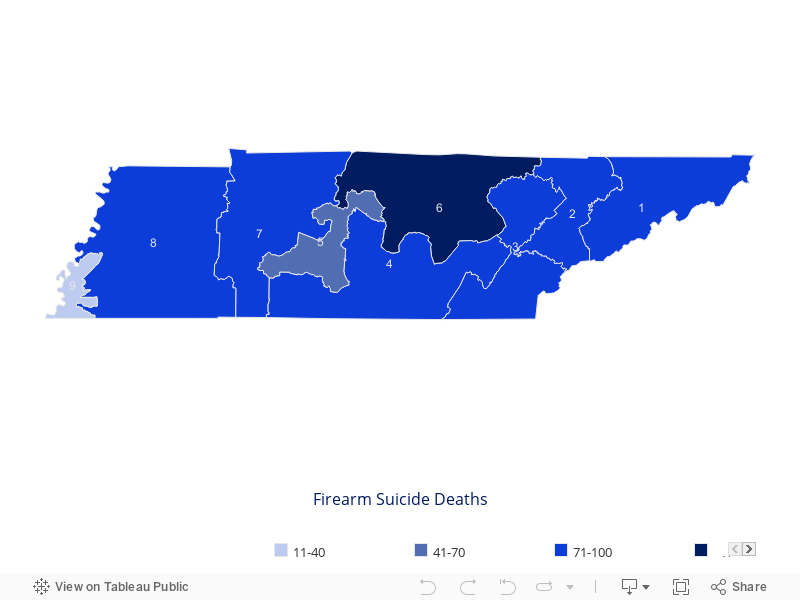
Table 3. States with the largest district-level range in firearm suicide rates
| State-district | Firearm suicides per year | Firearm suicide rate per 100,000 | Firearm suicide rate national rank | Firearm suicides as percent of all suicides |
|---|---|---|---|---|
| Arizona-04 | 139 | 18.0 | 1 | 63% |
| Arizona-07 | 50 | 6.3 | 252 | 53% |
| California-01 | 84 | 11.9 | 38 | 54% |
| California-40 | 13 | 1.9 | 411 | 29% |
| Florida-02 | 91 | 12.6 | 27 | 61% |
| Florida-24 | 30 | 4.0 | 334 | 43% |
| Georgia-09 | 97 | 13.2 | 16 | 67% |
| Georgia-05 | 39 | 5.1 | 294 | 53% |
| North Carolina-11 | 89 | 11.9 | 40 | 58% |
| North Carolina-04 | 34 | 4.1 | 330 | 45% |
| Oregon-02 | 112 | 13.9 | 7 | 58% |
| Oregon-03 | 59 | 7.1 | 213 | 42% |
| Pennsylvania-15 | 75 | 11.0 | 61 | 62% |
| Pennsylvania-03 | 23 | 3.2 | 359 | 34% |
| Tennessee-06 | 102 | 13.5 | 11 | 65% |
| Tennessee-09 | 38 | 5.4 | 284 | 63% |
| Texas-04 | 85 | 11.6 | 44 | 63% |
| Texas-15 | 31 | 4.0 | 336 | 49% |
| Virginia-06 | 84 | 11.2 | 42 | 61% |
| Virginia-08 | 27 | 3.4 | 355 | 40% |
Factors related to firearm suicide
Household firearm ownership
Nationally, nearly half of suicides involve a firearm. But this congressional district research shows that the national average masks enormous differences between districts. In New York state’s 13th District, which covers part of New York City, fewer than 10 people die by firearm suicide each year. Suicide with a gun makes up less than 10 percent of that district’s total annual suicide toll. This stands in marked contrast to Arizona’s 4th District which has an average of 139 firearm suicides per year, making up 63 percent of all suicides in that district.
Prior research has shown that suicide rates differ widely among the 50 states and that those differences are driven by the disparities in firearm suicides.17Matthew Miller et al., “Household Firearm Ownership and Rates of Suicide Across the 50 United States,” The Journal of Trauma: Injury, Infection, and Critical Care 62, no. 4 (April 2007): 1029–35, https://doi.org/10.1097/01.ta.0000198214.24056.40. This new district-level research confirms this pattern: 88 percent of the difference in congressional district-level suicide rates is explained by differences in firearm suicide. Figure 2, where each blue dot represents one district, demonstrates the very strong association between firearm suicide rates and overall suicide rates at the district level.
Figure 2. High congressional district firearm suicide rates predict high overall suicide rates
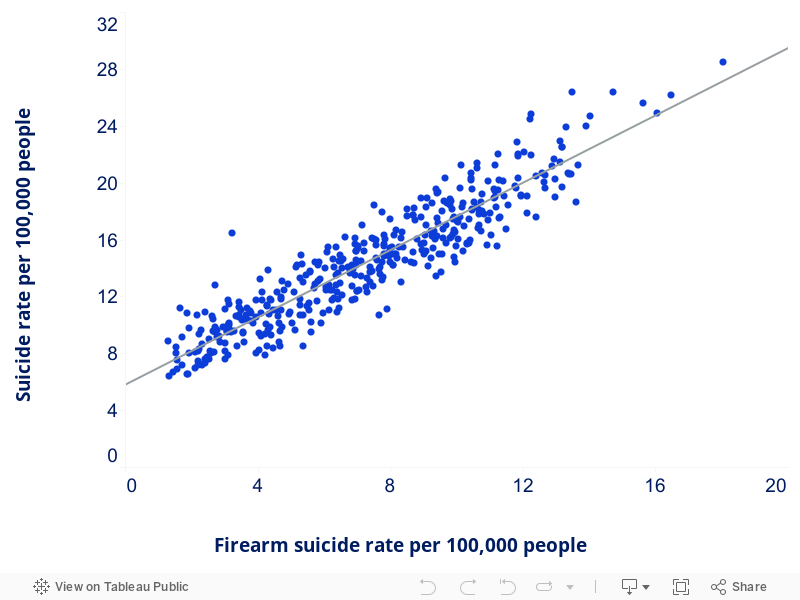
88%
88 percent of the difference in congressional district-level suicide rates is explained by differences in firearm suicide.
Everytown analysis of CDC WONDER firearm suicide data 2014–2018 and Census congressional district population.
One important question when trying to address firearm suicide is the relationship between the availability of a gun and the risk of suicide. A prevalent misconception about this serious public health issue is that if a person contemplating suicide is not able to get a firearm, they will use another method equally likely to result in death. While this is sometimes the case, nearly all other methods (such as hanging, poisoning, or drug overdose) are less lethal, making it less likely that an attempt will result in death. For example, 90 percent of suicide attempts using a gun result in death; by comparison, only 4 percent of suicide attempts by other means are fatal.18Andrew Conner, Deborah Azrael, and Matthew Miller, “Suicide Case-Fatality Rates in the United States, 2007to 2014: A Nationwide Population-Based Study,” Annals of Internal Medicine 171, no. 12 (2019): 885–95, https://bit.ly/3mvEhj6. Further, other methods that take longer to be fatal allow more time to change one’s mind or to potentially be rescued.
In short, because firearms are readily available in many US households and highly lethal, any strategy that aims to substantially reduce suicide in the United States must address access to firearms.
Survivor Stories
After giving birth, I was diagnosed with severe postpartum depression and became violently suicidal. I was given antidepressants but [was] never once asked if I had access to a firearm. At three months postpartum, I decided to end my life. I took my Smith & Wesson 9 mm pistol and held it to my temple, then underneath my chin. I found an extra box of ammunition on the top shelf of our closet and searched for hours through every dresser, junk drawer, and garage shelf for either one of the two magazines. I never found either. I overdosed on sertraline (antidepressant) to stop my brain function but wasn’t successful. Firearm suicide is uniquely lethal, and I’m alive today because I couldn’t find a magazine.
–Abbi
Rural firearm suicide
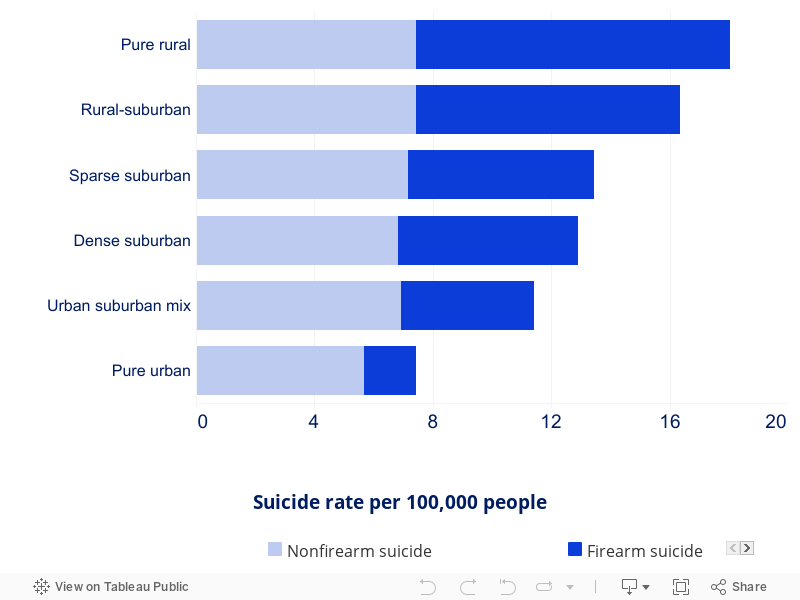
One clear pattern that emerges from this work is the relationship between population density and firearm suicide at the congressional district level. The group of districts with the highest firearm suicide rates are by and large districts with a large rural population—like those in Montana, Wyoming, Alaska, Colorado, Nevada, and others (see tables 4 and 5). Conversely, the districts with the lowest firearm suicide rates are largely urban districts in Massachusetts, New Jersey, New York, and Washington, DC (see tables 6 and 7). In fact, across levels of urbanization or rurality, there is little difference in the non-firearm suicide rate. Pure rural districts have rates of non-firearm suicide 1.3 times higher than pure urban districts. In the case of firearm suicide, however, the range is substantially larger. Pure rural districts have a firearm suicide rate 5 times higher than pure urban districts.Everytown analysis of CDC suicide data 2014–2018 and Census congressional district population using the CityLab Congressional Density Index, see Methods Note. In summary, the differences between overall urban and rural suicide rates in America’s congressional districts are driven by firearm suicide.
Figure 3. Firearm and non-firearm suicide rates by level of rurality
Rural America, of course, has tremendous diversity. But research shows that there are several factors common in rural counties that are associated with higher rates of suicide. One important factor is gun ownership: a nationwide Pew Research Survey found that while 19 percent of adults in urban areas reported that they owned a gun, 46 percent in rural areas did.19Pew Research Center, “America’s Complex Relationship with Guns,” June 2017, https://pewrsr.ch/2ZOhs09 A second set of factors is economic, impacted in large part by a changing labor market and declining rural job opportunities. These include poverty, unemployment, the vulnerability of agriculture to climate and trade changes, and shifts in mining and other rural occupations.20Jameson K. Hirsch and Kelly C. Cukrowicz, “Suicide in Rural Areas: An Updated Review of the Literature,” Journal of Rural Mental Health 38, no. 2 (2014): 65–78, https://bit.ly/2FGqrJT; Bindu Kalesan et al., “Intersections of Firearm Suicide, Drug-Related Mortality, and Economic Dependency in Rural America,” Journal of Surgical Research 256 (December 1, 2020): 96–102 https://bit.ly/2FCWmel. Recent research from Everytown found the economic fallout from the COVID-19 crisis could bring a 20 to 30 percent increase in firearm suicides in the US this year without immediate action. Another set of factors relates to the lack of access to mental health care in rural communities, including a shortage of providers, lack of health insurance, and a stigma against seeking care. Social isolation can play a role as well.21Jameson K. Hirsch and Kelly C. Cukrowicz, “Suicide in Rural Areas: An Updated Review of the Literature,” Journal of Rural Mental Health 38, no. 2 (2014): 65–78, https://bit.ly/35XDLEL Finally, the opioid epidemic has hit rural America hard. Misuse of this pain drug is a known risk factor for suicide22Nora Volkow, “Suicide Deaths Are a Major Component of the Opioid Crisis that Must Be Addressed,” National Institute on Drug Abuse, September 2019, https://bit.ly/3ksaRR2. and in rural communities, high firearm suicide rates, drug death rates, and opioid prescription rates often occur simultaneously.23Bindu Kalesan et al., “Intersections of Firearm Suicide,” 96–102. The recommendations section below outlines some actions that can be taken to address these factors.
Table 4. 10 highest firearm suicide rates in “pure rural” districts
| State-district | Firearm suicides per year (Pure rural district average 76) | Firearm suicide rate per 100,000 (Pure rural district average 10.6) | Firearm suicides as percent of all suicides (Pure rural district average 59%) |
|---|---|---|---|
| Montana-At large | 172 | 16.5 | 63% |
| Wyoming-At large | 93 | 16.1 | 64% |
| Alaska-At large | 115 | 15.6 | 61% |
| Colorado-03 | 109 | 14.7 | 56% |
| West Virginia-03 | 81 | 13.7 | 64% |
| Kentucky-05 | 95 | 13.6 | 73% |
| Tennessee-06 | 102 | 13.5 | 65% |
| Arkansas-01 | 97 | 13.4 | 65% |
| West Virginia-02 | 83 | 13.4 | 64% |
| Georgia-09 | 97 | 13.2 | 67% |
Table 5. 10 lowest firearm suicide rates in “pure rural districts”
| State-district | Firearm suicides per year (Pure rural district average 76) | Firearm suicide rate per 100,000 (Pure rural district average 10.6) | Firearm suicides as percent of all suicides (Pure rural district average 59%) |
|---|---|---|---|
| New York-27 | 34 | 4.8 | 36% |
| New York-23 | 39 | 5.6 | 40% |
| New York-21 | 40 | 5.7 | 45% |
| New York-19 | 40 | 5.7 | 40% |
| Iowa-04 | 50 | 6.6 | 47% |
| Illinois-15 | 46 | 6.6 | 41% |
| Minnesota-07 | 46 | 7.0 | 48% |
| Nebraska-03 | 43 | 7.1 | 49% |
| North Carolina-07 | 61 | 7.7 | 57% |
| Mississippi-02 | 56 | 7.9 | 71% |
Table 6. 10 highest firearm suicide rates in “pure urban” districts
| State-district | Firearm suicides per year (Pure urban district average 13) | Firearm suicide rate per 100,000 (Pure urban district average 1.8) | Firearm suicides as percent of all suicides (Pure urban district average 23%) |
|---|---|---|---|
| California-28 | 31 | 4.3 | 38% |
| Pennsylvania-03 | 23 | 3.2 | 34% |
| Pennsylvania-02 | 27 | 3.6 | 34% |
| California-37 | 19 | 2.7 | 33% |
| California-47 | 22 | 3.1 | 33% |
| Illinois-04 | 17 | 2.4 | 33% |
| Illinois-07 | 17 | 2.3 | 32% |
| California-38 | 18 | 2.5 | 32% |
| California-29 | 18 | 2.5 | 32% |
| California-43 | 16 | 2.3 | 31% |
Table 7. 10 lowest firearm suicide rates in “pure urban” districts
| State-district | Firearm suicides per year (Pure urban district average 13) | Firearm suicide rate per 100,000 (Pure urban district average 1.8) | Firearm suicides as percent of all suicides (Pure urban district average 23%) |
|---|---|---|---|
| New York-13 | <10 | <1.5 | <25% |
| New York-05 | <10 | <1.5 | <25% |
| New York-15 | <10 | <1.5 | <25% |
| New York-08 | <10 | <1.5 | <25% |
| New York-07 | <10 | <1.5 | <25% |
| New York-09 | <10 | <1.5 | <25% |
| New York-12 | <10 | <1.5 | <25% |
| New York-10 | <10 | <1.5 | <25% |
| New York-14 | <10 | <1.5 | <25% |
| New York-06 | <10 | <1.5 | <25% |
Gender, race and ethnicity
Firearm suicide rates also differ across congressional districts because firearm suicide rates differ by gender, race, and ethnicity. Firearm suicides among girls and women make up 14 percent of all firearm suicides. These rates vary little by age in every racial and ethnic group.24CDC WONDER, Underlying Cause of Death, 2014–2018. Boys and men make up the remaining 86 percent of firearm suicides nationally.
Firearm suicide occurs predominantly among males
87%
Men represent 87% of firearm suicide victims.
While a rise in the female firearm suicide rate over the past decade is concerning, this increase starts from a very low base number, meaning firearm suicide remains largely a male issue. Women are more likely to attempt suicide compared to men,25Substance Abuse and Mental Health Service Administration (SAMHSA), “National Survey on Drug Use and Health,” 2018, https://bit.ly/3muEeE6. Conner et al., “Suicide Case Fatality Rates,” 885-95. See Methods Note. yet men account for the vast majority of firearm suicide deaths. When contrasting suicide by poisoning for both men and women, the rates are virtually the same. With a firearm, however, the rate of male suicide is seven times higher than for that of female suicide.26CDC, WONDER Underlying Cause of Death, 2014–2018. Why? Because men tend to have far greater access to firearms.27NORC, “General Social Survey Final Report:Trends in Gun Ownership in the United States, 1972-2018,” 2019, https://bit.ly/2RAUchI.
The vital message from this research is that for both women—who have a higher likelihood of suicide attempts—and men—who have a higher likelihood of easy access to a gun—the most important thing we can do to reduce the risk of tragedy is to disrupt access to firearms for people who are in crisis.
Rates of firearm suicide also range widely by race and ethnicity, with white Americans having the highest rates followed by American Indians and Alaska Natives (see figure 4). Breaking the data down further within racial and ethnic groups, there are age and gender factors that are important for crafting solutions.
Figure 4. Firearm suicide rates by race and ethnicity
Among men 40 or older, white males have the highest rates of firearm suicide.28CDC WONDER, Underlying Cause of Death, 2014–2018. See Methods Note. For younger males, firearm suicide rates are highest among American Indian and Alaskan Native populations.29CDC WONDER, Underlying Cause of Death, 2014–2018. See Methods Note. The severely disproportionate impact of suicide with a firearm and by other means, on white men calls for further examination. White men account for over 60 percent of all suicide deaths,30 CDC WONDER, Underlying Cause of Death, 2014–2018. with middle-aged white men having the highest rates.31 American Foundation for Suicide Prevention, “Suicide Statistics,” https://bit.ly/2FFOUyJ When looking specifically at suicide by firearm, white men 65 and older have tremendously elevated rates. Eight in 10 suicides among this population are by firearm.32CDC WONDER, Underlying Cause of Death, 2014–2018.
Studies on white male suicide rates focus on several theories. One has to do with economic shifts and attributes the unprecedented drop in overall life expectancy in the US to white Americans without a four-year college degree dying prematurely as a result of suicide, opioid overdose, and alcoholism. This decline in life expectancy began roughly in 2000. Before this downturn, American life expectancy had been predictably increasing for all Americans for 80 years. This trend was discovered by two Princeton economists, Angus Deaton and Anne Case, who called these “deaths of despair,” and attributed them largely to the shift in work opportunities and conditions for working class men. Decades of wage stagnation, weakened union protections, and the offshoring of manufacturing jobs that previously paid decent wages and didn’t require advanced degrees, have led to “the destruction of a way of life” for less educated white men and, with it, tremendous loss of dignity, pride, and purpose.33Anne Case and Angus Deaton, Deaths of Despair and the Future of Capitalism, Princeton: Princeton University Press, 2020. A second theory is related to culture. This manifests itself in terms of a traditional male tendency to “tough things out” and the stigma around reporting or seeking help for emotional problems and mental health struggles among men. White men are twice as likely to be gun owners as white women and non-white men34Pew Research Center, “America’s Complex Relationship with Guns.” and this increased likelihood of access to a firearm, together with the dramatic economic shifts and other cultural factors has created a dangerous mix that contributes to an average of nearly two white men dying by firearm suicide every hour.35CDC WONDER, Underlying Cause of Death, 2014–2018.
The group with the second highest overall rate of firearm suicide and the highest rate among men 40 and under is American Indian and Alaska Natives. Congressional districts with a higher proportion of American Indian and/or Alaskan Native populations have relatively higher firearm suicide rates (see table 8). There are 11 districts—in Alaska, Montana, New Mexico, North Carolina, Oklahoma, and South Dakota—where at least 7.5 percent of the population identify as American Indian or Alaska Native. In these districts, both overall suicide and firearm suicide rates are concerningly elevated, with an annual average of 97 firearm suicides and 170 suicides overall.
While different circumstances in communities contribute to different factors, CDC studies have pointed to the fact that many American Indians and Alaska Natives live in rural communities, making the above discussion especially relevant. In particular, the risk of suicide is increased by the dearth of mental health care providers in rural areas, particularly culturally competent providers, and the stigma around seeking mental health care. Additionally, another risk factor for suicide is a family history of suicide. While close bonds in tribes can help prevent suicide, the loss of loved ones to suicide in the past comes into play as a risk factor in tight knit communities with high suicide rates, carrying the trauma across generations.36Rachel A. Leavitt et al, “Suicides Among American Indian/Alaska Natives—National Violent Death Reporting System, 18 States, 2003–2014,” Morbidity and Mortality Weekly Report (MMWR) 67, no. 8 (March 2, 2018), https://bit.ly/32BXgQS. Finally, alcohol use is also recognized as a risk factor and a particular challenge among young people in these communities.37Leavitt et al., “Suicides Among American Indian/Alaska Natives.”
Table 8. Highest firearm suicide rates, districts with at least 7.5 percent American Indian or Alaskan Native population
| State-district | Firearm suicides per year (district average 52) | Firearm suicide rate per 100,000 (district average 7.1) | Firearm suicide rate national rank | Suicides per year (district average 105) | Suicide rate per 100,000 (district average 14.1) | % American Indian or Alaskan Native (district average 1%) |
|---|---|---|---|---|---|---|
| Montana-At large | 172 | 16.5 | 2 | 273 | 26.2 | 8% |
| Alaska-At large | 115 | 15.6 | 4 | 189 | 25.6 | 20% |
| Oklahoma-02 | 98 | 13.1 | 19 | 171 | 22.9 | 27% |
| Oklahoma-03 | 101 | 13.0 | 20 | 157 | 20.2 | 10% |
| New Mexico-03 | 85 | 12.3 | 30 | 173 | 24.8 | 20% |
| Arizona-01 | 92 | 12.2 | 32 | 184 | 24.5 | 25% |
| Oklahoma-01 | 90 | 11.3 | 52 | 155 | 19.5 | 12% |
| Oklahoma-04 | 87 | 11.2 | 57 | 152 | 19.4 | 10% |
| Oklahoma-05 | 85 | 10.5 | 78 | 147 | 18.1 | 8% |
| South Dakota-At large | 81 | 9.4 | 126 | 167 | 19.3 | 10% |
| North Carolina-09 | 57 | 7.3 | 210 | 99 | 12.7 | 9% |
Recommendations for Action
The fact that 23,000 American lives are claimed each year by a preventable cause is tragic. However, our increasing understanding of the types of life-saving policies, interventions, and behavioral changes needed to prevent suicide is very promising. The above data and analysis are another step toward educating people on what matters most when it comes to preventing suicide and can provide tools for holding elected officials accountable for taking steps to protect the lives of their constituents. The following are key policies, storage practices, public education initiatives, services, investments, and conversations that are effective in reducing firearm suicide.
Gun storage practices
Secure storage and voluntary, temporary, removal of guns
Experts across the board—from medical associations and suicide prevention organizations to gun sporting groups—recommend removing access to guns from those at risk of suicide. This includes temporarily storing guns away from the home (in some cases storing them with another family member or friend) until the moment of crisis passes. Many businesses, such as gun shops and shooting ranges, and law enforcement agencies offer voluntary, temporary storage of guns until a person is no longer at risk. The Colorado Firearm Safety Coalition developed the Gun Storage Map, the first online tool which allows users to easily locate facilities in the state willing to temporarily store guns. Online firearm storage maps are now also available in Washington and Maryland.
Of the 23,000 Americans who die by firearm suicide each year, over 1,100 of them are children and teens.38CDC WONDER, Underlying Cause of Death, 2014–2018. Children and teens are defined as ages 0 to 19. Responsible gun owners make their own homes and their communities safer by storing their firearms unloaded and locked and keeping ammunition in a separate place. This helps to prevent children and other people who are at risk of harming themselves or others from accessing firearms. Research shows that secure gun storage practices play an essential role in reducing firearm suicide among children and teens.39Michael C. Monuteaux, Deborah Azrael, and Matthew Miller, “Association of Increased Safe Household Firearm Storage with Firearm Suicide and Unintentional Death Among US Youths,” Journal of American Medical Association Pediatrics 173, no. 7 (2019): 657-62. Moms Demand Action for Gun Sense in America, the grassroots movement of Everytown for Gun Safety, has a campaign called Be SMART that raises awareness of the fact that responsible gun storage can save children’s lives. Be SMART provides resources and trained volunteers to support and encourage communities to practice secure firearm storage and to prevent children from accessing firearms.
One idea currently being piloted in Washington state is “Voluntary Do Not Buy” lists, sometimes referred to as “Voluntary Prohibition” lists. These lists, which took effect in 2019, empower those who know they are at risk to voluntarily put themselves on a list that prevents them from buying guns. Other states are watching this experiment.
Survivor Stories
“My family secretly removed my gun. When I went to kill myself, it was gone. They saved my life. I didn’t realize that until 30 years later, as I sat in a Moms Demand Action meeting. I left that day knowing I was a survivor. It gives me chills now. I’ll continue fighting for common-sense solutions to gun violence. I will continue to fight for red flag laws. I was lucky my family knew there was a mental health crisis.”
-Patti
Education
Build awareness about the risk of firearms
For many years, gun dealers, law enforcement, medical professionals, and other trusted messengers have engaged in initiatives that build public awareness about the risks of firearms and how to mitigate those risks for themselves and their families.
Gun dealers across the country have a role to play in educating the public about firearm suicide prevention. The Gun Shop Project is an example of a successful partnership between gun owner groups and suicide prevention advocates. This nationwide project educates gun stores and ranges on how to look for distraught customers and encourages these gun shops to display and distribute materials about firearms and suicide. An evaluation of the program in New Hampshire found that nearly half of independent gun shops in the state displayed suicide prevention materials and resources.40Mary Vriniotis et al., “A Suicide Prevention Campaign for Firearm Dealers in New Hampshire,” Suicide and Life-Threatening Behavior 45, no. 2 (2015): 157–63, https://bit.ly/2RA2aHN.
Research shows that warning labels, like those visible on cigarette packages, can have a significant impact on public perception and behaviors.41Sabine Glock, Dagmar Unz, and Carrie Kovacs, “Beyond Fear Appeals: Contradicting Positive Smoking Outcome Expectancies to Influence Smokers’ Implicit Attitudes, Perception, and Behavior,” Addictive Behaviors 37, no. 4 (2012): 548-51, https://bit.ly/33ByLTk; Debra Martens, “Graphic Tobacco Warnings Having Desired Effect,” Canadian Medical Association Journal 166, no. 11 (2002): 1453; RAND. William Shadel et al., “Do Graphic Health Warning Labels on Cigarette Packages Deter Purchases at Point-of-Sale?” Health Education Research 34, no. 3 (2019): 321–31; https://bit.ly/2RCN7xe In 2018, the King County Board of Health in Washington state passed a law that required gun dealers and ranges to post signs warning about the danger of firearms. The sign reads: “WARNING: The presence of a firearm in the home significantly increases the risk of suicide, homicide death during domestic violence disputes, and unintentional deaths to children, household members, and others.42King County, Rule & Regulation BOH 18-04, Relating to disclosure of information on health risks related to firearms. https://bit.ly/3kqMpzj Massachusetts has passed similar warning sign legislation.43Massachusetts, MGL ch. 140, § 123 Requiring that information on suicide prevention is posted and presented. https://bit.ly/32EI4Th
Several law enforcement agencies warn gun owners or permit holders about the risk of guns and suicide. For example, as part of the process for obtaining a concealed carry permit, applicants in Multnomah County, Oregon, are provided materials and given training on the relationship between suicide and firearms.44“Is your safety on? Firearms and suicide,” Multnomah County Health Department, https://bit.ly/2lwa7h4 A similar initiative exists in New York City.45NYC Administrative Code § 10-313.
These efforts, in addition to public outreach to gun owners and non-gun owners about secure firearm storage and the availability of crisis support resources (e.g., suicide crisis lines, alcohol and substance use treatment, and mental health treatment) should be continued and expanded.
Policies
Limit the easy and immediate acquisition of firearms
When someone is in a moment of crisis, disrupting their access to firearms can save their life. The vast majority of people who survive a suicide attempt do not go on to die by suicide.46David Owens, Judith Horrocks, and Allan House, “Fatal and Non-Fatal Repetition of Self-Harm: Systematic Review,” British Journal of Psychiatry 181, no. 3 (2002): 193–99, https://bit.ly/3iArcCB. Three gun safety policies in particular are shown to limit the easy and immediate acquisition of firearms and reduce suicide rates.
- Extreme risk laws, also referred to as “red flag” laws, allow loved ones or law enforcement to intervene by petitioning a court for an order to temporarily prevent someone in crisis from accessing guns, giving them a second chance to get the help they need.
- Waiting period laws require a certain number of days—a “waiting period”—between when someone purchases a firearm and when they can actually take possession of that firearm, creating a buffer between a potential suicidal crisis and access to a gun.
- Permit-to-purchase laws, in addition to background checks on all gun sales, ensure that a person attempting to buy a gun is not legally prohibited from having the gun for any reason, including prohibitions because they are under age, subject to an extreme risk order, or due to mental illness.
Expanded resources
Medical and mental health services
Doctors and other medical professionals have an important role to play in discussing behavioral risks with their patients. Roughly 2 in 3 Americans who attempt suicide will visit a health care professional in the month before the attempt.47Brian K. Ahmedani et al., “Racial/Ethnic Differences in Healthcare Visits Made Prior to Suicide Attempt Across the United States,” Medical Care 53, no. 5 (2015): 430–35, https://dx.doi.org/10.1097/MLR.0000000000000335. Increased access to mental health and medical services, including strengthened access to suicide prevention services, can help prevent a rise in suicide deaths. In a system in which health care coverage is often tied to employment, losing a job can also mean losing access to mental health services at a time when they are most needed.
It is important that suicide prevention services and providers reflect the values, beliefs, and culture of any target group. For example, given the strong link between family history of suicide and suicide attempts among American Indian and Alaska Natives, strategies that provide support in the aftermath of a suicide, such as survivor support groups, and strategies that ensure safe media reporting on suicides, are essential. Among young American Indian and Alaska Natives in particular, services should include youth-focused alcohol and substance use treatment and life skills development programs.
To expand access to mental health and medical services and prevent suicides, the CDC recommends providing medical benefits, ensuring coverage of mental health and substance use treatment in health insurance policies, increasing the number of medical and mental health providers in underserved areas, and providing lethal means counseling in health care settings.48Deborah Stone et al., “Preventing Suicide: A Technical Package of Policies, Programs, and Practice” (Centers for Disease Control and Prevention, National Center for Injury Prevention and Control, Division of Violence Prevention, 2017), https://bit.ly/2FCaSmA.
Health care professionals are well positioned to prevent suicide by educating patients about the risk of firearm access. Counseling on Access to Lethal Means (CALM) trains medical professionals on how to explain the differing lethality of various suicide methods and how to “help clients at risk of suicide and their families reduce access to lethal means, particularly firearms.”49“CALM: Counseling on Access to Lethal Means,” Suicide Prevention Resource Center, https://bit.ly/2OvUN1B. Research suggests CALM is effective at increasing knowledge and comfort levels among mental health professionals for talking about means restriction with their clients.50Elizabeth Sale et al., “Counseling on Access to Lethal Means (CALM): An Evaluation of a Suicide Prevention Means Restriction Training Program for Mental Health Providers,” Community Mental Health Journal 54, no. 3 (2018): 293–301. Lock to Live, another intervention for use in a clinical setting, is an online decision-making tool that helps patients consider storage options for firearms and other lethal means. Early research suggests the decision aid may be a promising tool to strengthen lethal means counseling.51Marian Betz et al., “’Lock to Live’: Development of a Firearm Storage Decision Aid to Enhance Lethal Means Counselling and Prevent Suicide,” Injury Prevention 25, no. 1 (2019): i18-i24, https://doi.org/10.1136/injuryprev-2018-04294.
Economic support
Mitigate suicide risk
Studies have found that US states that offer higher-than-average unemployment benefits over time offset the impact of unemployment on suicide.52 Jonathan Cylus, M. Maria Glymour, and Mauricio Avendano, “Do Generous Unemployment Benefit Programs Reduce Suicide Rates? A State Fixed-Effect Analysis Covering 1968–2008,” American Journal of Epidemiology 180, no. 1 (2014): 45–52, https://bit.ly/2ZO2k2K. The CDC’s recommendations for suicide prevention highlight economic support programs and policies that mitigate suicide risk factors by reducing the strain of paying for food, medical care, housing, and other basic expenses on families. The CDC provides evidence of the effectiveness in lowering suicide rates of higher spending on such programs as unemployment insurance, household subsidies to reduce eviction and foreclosure, Temporary Assistance for Needy Families (TANF), and public assistance for medical benefits.53Deborah Stone et al., “Preventing Suicide.” Other high-income countries that have funded workforce programs, job search training, and other economic supports during recessions have mitigated the risk of suicide compared to those that cut programs intended to buffer a recession’s impacts on households.54Camilla Haw et al., “Economic Recession and Suicidal Behaviour,” The International Journal of Social Psychiatry 61, no. 1 (2015): 73–81.
Funding
Federal research on firearm suicide
For nearly 25 years, Congress dramatically curtailed the ability of both the CDC and the National Institutes of Health (NIH) to conduct firearm research through the Dickey Amendment.55Omnibus Consolidated Appropriations Act, Public Law 104-208 (1996). These budget restrictions were deliberate efforts by the gun lobby to suppress gun research following landmark studies examining the impact of firearms on public health and safety.56Christin Jamieson, “Gun Violence Research: History of the Federal Funding Freeze,” Psychological Science Agenda, February 2013, https://bit.ly/2SDVXxB.
In 2019, for the first time in decades, Congress appropriated $25 million for gun violence research57Jessie Hellmann, “Congress Reaches Deal to Fund Gun Violence Research for First Time in Decades,” The Hill, December 16, 2019, https://bit.ly/2QOz6wb.—but there is still much more to be done to guide policy-making and predictable annual funding is needed in order to understand changes in gun violence over time. Research and data are integral to prevention, but without adequate resources, researchers are prevented from thoroughly examining gun violence and gun policies. Key areas for further research include: how to better convey the suicide risks associated with firearm ownership; understanding of where and when people who attempt or die by suicide obtained their firearms; how societal, economic, and relationship factors may reduce firearm suicide risks; and how to identify and mitigate risk among high-risk individuals in clinical settings.
Conversations
To act on warning signs
Suicide is complex, but it is preventable. Family, friends, and others can play a role in suicide prevention by recognizing the risk factors and warning signs of suicide. If you think someone is in distress, asking them if they are having thoughts of killing themselves could save their lives. Contrary to popular belief, research overwhelmingly shows that asking a person about suicidal intent or self-harm does not lead them to have more suicidal thoughts.58Christine Polihronis et al., “What’s the Harm in Asking? A Systematic Review and Meta-Analysis on the Risks of Asking About Suicide-Related Behaviors and Self-Harm with Quality Appraisal,” Archives of Suicide Research (2020), https://doi.org/10.1080/13811118.2020.1793857. Many suicide prevention and mental health organizations offer resources on how to have an open and honest conversation about suicide.
If you or someone you know is in crisis, please call or text 988, or visit 988lifeline.org/chat to chat with a counselor from the 988 Suicide & Crisis Lifeline, previously known as the National Suicide Prevention Lifeline. The 988 Suicide & Crisis Lifeline provides 24/7, free, and confidential support to people in suicidal crisis or emotional distress anywhere in the US.
Acknowledgments
Everytown for Gun Safety would like to thank Deborah Azrael of the T. H. Chan Harvard School of Public Health and Matthew Miller of Northeastern University’s Bouvé College of Health Sciences for their invaluable comments on the methodology and report.
Learn About Firearm Suicide in Your Congressional District
Everytown Research & Policy is a program of Everytown for Gun Safety Support Fund, an independent, non-partisan organization dedicated to understanding and reducing gun violence. Everytown Research & Policy works to do so by conducting methodologically rigorous research, supporting evidence-based policies, and communicating this knowledge to the American public.