Methods Note
Firearm Suicide by Congressional District: How Does Your District Stack Up?
This methods note is a companion to Firearm Suicide by Congresional District: How Does Your District Stack Up? Everytown Research used data from the Centers for Disease Control and Prevention (CDC) and the US Census Bureau to fill a gap in availability of data on firearm suicide. Currently, the CDC provides data on suicide and firearm suicide by state and county on an annual basis, but not by congressional district.
Congressional districts are a valuable geographic unit for data analysis because they all have roughly the same population size—approximately 740,000 residents for the 116th Congress (2019–2020). This enables residents and elected officials to evaluate key challenges and achievements in their district in comparison to those of neighboring districts and enables them to make an apples-to-apples comparison.
In order to address this unmet need for data on firearm suicide for America’s congressional districts,1Analysis includes 435 voting districts and the non-voting congressional district of Washington, DC. Everytown Research has used CDC data on firearm and all suicide at the county-level2Centers for Disease Control and Prevention (CDC), Wide-ranging OnLine Data for Epidemiologic Research (WONDER), Underlying Cause of Death, 2014–2018. combined with demographic data from the US Census Bureau’s Summary File for Congressional District (S16)3US Department of Commerce, US Census Bureau, “2010 Census Congressional District Summary File (116th Congress)—Technical Documentation” (2019), https://bit.ly/33KlUOy. and the American Community Survey for the 116th Congress42014-2018 5-year estimates as obtained from https://data.census.gov. to calculate both rates and counts of firearm suicide and suicide by any mechanism.
Technical Notes
Rural firearm suicide: Pure rural districts have rates of non-firearm suicide 1.3 times higher than pure urban districts.5Everytown analysis of CDC WONDER 2014-2018 using the CityLab Congressional Density Index In the case of firearm suicide, however, the range is substantially larger. Pure rural districts have a firearm suicide rate 5 times higher than pure urban districts. The crude rate of non-firearm suicide is 5.66 per 100,000 in pure urban districts compared to 7.44 per 100,000 people in pure rural districts. Completely urban districts (35 districts in six states and Washington, DC) have the lowest average crude rate of firearm suicide—1.77 per 100,000 people. Completely rural districts (70 districts in 34 states) have the highest average crude rate of firearm suicide, 10.60 per 100,000 people or more than 5 times the rate in completely urban districts.
Gender and suicide: Women are more likely to attempt suicide compared to men, yet men account for the vast majority of firearm suicide deaths. From the National Survey on Drug Use and Health, we know that 0.5% of men (age 18 and older) reported having attempted suicide one or more times in the past 12 months compared to 0.7% of women.6Substance Abuse and Mental Health Service Administration (SAMHSA), “National Survey on Drug Use and Health,” 2018, https://bit.ly/3cjcv4E. Additionally, analysis of hospital datasets by the Healthcare Cost and Utilization Project (HCUP) found that there were 170 suicide attempts per 100,000 females per year and 144 suicide attempts per 100,000 males on average from 2007 to 2014, yet there were four times as many male suicide deaths.7Andrew Conner, Deborah Azrael, and Matthew Miller, “Suicide Case-Fatality Rates in the United States, 2007to 2014: A Nationwide Population-Based Study,” Annals of Internal Medicine 171, no. 12 (2019): 885–95, https://bit.ly/3iJNAtn.
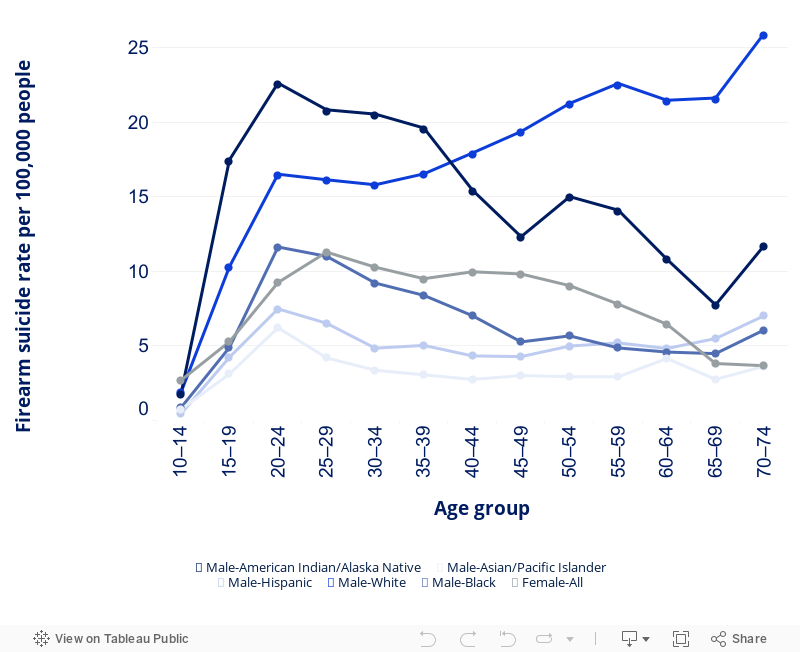
Firearm suicide rates for males aged 40 and older: Among men 40 and older, white males have the highest rates of firearm suicide. According to the CDC’s Wide-ranging OnLine Data for Epidemiologic Research (WONDER), the firearm suicide rates for males aged 40 and older from 2014 to 2018 are: Non-Hispanic whites 23.48 per 100,000; Non-Hispanic American Indians and Alaska Natives 13.41 per 100,000; Non-Hispanic Blacks 5.72 per 100,000; Hispanic 5.20 per 100,000; and Non-Hispanic Asian and Pacific Islanders 3.11 per 100,000.8CDC WONDER, Underlying Cause of Death, 2014–2018.
Firearm suicide rates for males aged 10 to 39 years old: For younger males, firearm suicide rates are highest among American Indian and Alaskan Native populations. According to CDC WONDER, firearm suicide rates for males ages 10 to 39 from 2014 to 2018 are: Non-Hispanic American Indians and Alaska Natives 17.11 per 100,000; Non-Hispanic whites 13.07 per 100,000; Non-Hispanic Blacks 7.73 per 100,000; Hispanic 4.73 per 100,000; and Non-Hispanic Asian and Pacific Islanders 3.55 per 100,000. In the same period, suicide was the second leading cause of death for American Indian and Alaska Natives, among both sexes between the ages of 10 and 39.9 CDC WONDER, Underlying Cause of Death, 2014–2018.
Data sources
County counts of firearm suicide and all other forms of suicide, sorted by sex and race and Hispanic origin, were obtained from CDC WONDER. Because the CDC suppresses death counts less than 10 at a subnational level to protect privacy, five years of data, from 2014 to 2018, were used to minimize suppression of data and stabilize rates. Because of small counts and frequent suppression, race and ethnic populations were grouped according to similar rates (see figure 1).10Allison Ertl et al., “Surveillance for Violent Deaths—National Violent Death Reporting System, 32 States, 2016,” Morbidity and Mortality Weekly Report (MMWR) Surveillance Summaries 68, no. 9 (October 4, 2019): 1–36, https://bit.ly/2H6LEgs. Deborah Stone et al., “Preventing Suicide: A Technical Package of Policies, Programs, and Practice” (Centers for Disease Control and Prevention, National Center for Injury Prevention and Control, Division of Violence Prevention, 2017), https://bit.ly/3mBoI9i. Therefore, four sets of county-level counts were obtained:
- Male, all races, all Hispanic origins
- Male, non-Hispanic white and American Indian and Alaskan Native races
- Female, all races, all Hispanic origins
- Female, non-Hispanic white and American Indian and Alaskan Native races
Two sets of county-level counts were then calculated as the difference between the overall category and the specified races and Hispanic origin:
- Male, non-Hispanic Black, non-Hispanic Asian and Pacific Islander, and Hispanics (all races)
- Female, non-Hispanic Black, non-Hispanic Asian and Pacific Islander, and Hispanics (all races)
Age-adjusted county-level rates for the non-white, non-American Indian or Alaskan Native groups could not be directly obtained because of the difference in Hispanic origin and the way in which the CDC WONDER page allows for selection of race and ethnicity. For these age-adjusted rates, the county-level rates for Black and Asian and Pacific Islanders, all Hispanic origins were used instead.
Figure 1. Race, sex, and Hispanic origin rates of firearm suicide by age group
Five-year total deaths and age-adjusted rates for firearm and all suicide as defined by the International Statistical Classification of Diseases and Related Health Problems (ICD-10) codes by demographic group were downloaded from CDC WONDER’s underlying cause of death files for the period 2014 to 2018. For at-large districts, age-adjusted rates for the states were also obtained from CDC WONDER.
ICD-10 Codes for firearm suicide:
- X72 (Intentional self-harm by handgun discharge)
- X73 (Intentional self-harm by rifle, shotgun, and larger firearm discharge)
- X74 (Intentional self-harm by other and unspecified firearm discharge)
ICD-10 Codes for all suicide mechanisms, including firearm suicide:
- X60–X84 (Intentional self-harm)
Mapping counties to congressional districts
Aggregating up from the smallest level of publicly available counts of deaths—counties—is not ideal for congressional districts because county borders do not fit neatly into congressional districts as many US counties straddle two or more districts and many districts include parts of two or more counties. If the distribution of gun suicides was relatively even within a county, one could then simply divide county-level suicides by the proportion of the population of a county that is contained within that district. However, neither overall suicide nor firearm suicide are distributed evenly across the population; rather, they vary by age, sex, and race.
To account for differences in how county populations are split across districts, Census tract populations for counties and congressional districts for the 116th Congress borders from the 2010 census counts by sex, race, and Hispanic origin were obtained from the Census summary file for the 116th Congress.11US Department of Commerce, US Census Bureau, “2010 Census Congressional District Summary File (116th Congress)—Technical Documentation” (2019), https://bit.ly/33KlUOy.; Yongping Hao et al., “US Congressional District Cancer Death Rates,” International Journal of Health Geographics 5, no. 28 (2006), https://doi.org/10.1186/1476-072X-5-28.; Rebecca L. Siegel et al., “Cancer Death Rates in US Congressional Districts,” CA: A Cancer Journal for Clinicians 65, no. 5 (October 2015): 339–44, https://doi.org/10.3322/caac.21292. Unlike counties, census tracts are not cut up across multiple congressional districts, thus facilitating this approach. There are more than 70,000 census tracts in the US. For the six sex, race, and Hispanic origin groups noted above, two sets of weights were created:
- Proportion of county population allocated to the congressional district
- Proportion of the congressional district population from the county
Allocation of counts from the county to the congressional district and calculation of rates for the congressional district was based upon the methods used by the American Cancer Society and the CDC when calculating congressional district cancer mortality.12Centers for Disease Control and Prevention (CDC), “United States Cancer Statistics–Congressional District Estimates,” https://bit.ly/2FLKNBo; Yongping Hao et al., “US Congressional District Cancer Death Rates,” International Journal of Health Geographics 5, no. 28 (2006), https://doi.org/10.1186/1476-072X-5-28; Rebecca L. Siegel et al., “Cancer Death Rates in US Congressional Districts,” CA: A Cancer Journal for Clinicians 65, no. 5 (October 2015): 339–44, https://doi.org/10.3322/caac.21292. Counts of suicides and firearm suicides for the congressional districts were calculated by weighting county counts by the proportion of the county population allocated to the congressional district for that population group. The weighted counts were then summed over the counties in the congressional district.
Age-adjusted rates of suicides and firearm suicides for the congressional districts were calculated by weighting against the proportion of the congressional district from the county and then summing the weighted rates over the counties in the congressional district.
Estimated rates and counts were replaced by actual state rates and counts for both firearm suicide and overall suicide for the eight at-large congressional districts that follow state or federal district boundaries: Alaska, Delaware, District of Columbia, Montana, North Dakota, South Dakota, Vermont, and Wyoming.
Accounting for suppressed data
The CDC suppresses data when death counts for the requested disaggregation are less than 10. Suppressed counts of deaths were imputed by multiplying the population of the county by the state-level crude rate of death for both suicide and firearm suicide. In cases where estimated deaths exceeded 9.5, they were replaced with 9.5 given that actual deaths in excess of nine would not have been suppressed by the CDC.
Across the 43 states that do not have an at-large congressional district in the 116th Congress, 10 states had more than 40 percent of their counties suppressed even as totaled across all sex, race, and ethnicity groups: Arkansas (31/75), Colorado (31/64), Iowa (70/99), Illinois (47/102), Kansas (77/105), Minnesota (47/87), Mississippi (34/82), Nebraska (82/93), Nevada (7/17), and Texas (126/254).
In summary, while there are a high number of counties that had suppressed counts for county-level deaths, the methodology limited the bias introduced from this suppression in the following ways:
- Missing county-level data was imputed at the state average rate for that population group.
- Suppressed counts were not missing completely at random, they were known to be in the range of zero to nine.
- Most firearm suicide deaths (90 percent overall) were known and not suppressed: 94 percent (92,698/98,656) of male firearm suicides were reported; 63 percent (10,060/15,972) of female firearm suicides were reported.
- Suppression was lower for all suicide, which included firearm suicide, and also bounded the suppressed data for firearm suicide (counts of suppressed firearm suicide could not exceed counts of all suicide).
Table 1. County-level firearm suicide statistics on 3,143 US counties, 2014–2018
| Measure | Male | Female |
|---|---|---|
| Average annual firearm suicides | 10 | <10 |
| Minimum annual firearm suicides | <10 | <10 |
| Maximum annual firearm suicides | 329 | 63 |
| Number of counties suppressed (<10) | 1,331 | 2,734 |
| Average firearm suicide age-adjusted rate | 16.90 | 2.61 |
| Minimum firearm suicide age-adjusted rate | 0.85 | 0.47 |
| Maximum firearm suicide age-adjusted rate | 48.02 | 6.53 |
| Average population | 50,654 | 52,228 |
| Minimum population | 42 | 47 |
| Maximum population | 5.00 million | 5.14 million |
The unweighted average age-adjusted rate of firearm suicide across congressional districts is the most similar to the national average (6.62 compared to 6.71 per 100,000 people); unweighted state and county-level averages are much higher because of the number of states and counties with small populations but high rates.
Table 2. Key statistics across state, congressional district, and county levels, 2014–2018
| Key statistic | Measure | State | Congressional District | County |
|---|---|---|---|---|
| Average firearm suicide deaths per year | Average | 449 | 52 | <10 |
| Lowest | <10 | <10 | <10 | |
| Highest | 2,044 | 172 | 390 | |
| Number surpressed | 1 | 15 | 1,175 | |
| Age-adjusted firearm suicides per 100,000 people | Average | 8.11 | 6.62 | 9.86 |
| Lowest | 1.24 | 0.84 | 0.4 | |
| Highest | 16.02 | 16.02 | 30.40 | |
| Total population | Count | 51 | 436 | 3,143 |
| Average | 6.34 million | 740,603 | 102,883 | |
| Lowest | 0.58 million | 523,8551 | 88 | |
| Highest | 39.26 million | 1.04 million | 10.14 million |
Limitations and validations
The estimates are limited according to available data from the CDC and Census as well as simplifying assumptions.
Using county-level counts and rates for the populations does assume that differences in suicide rates by counties, possibly because of local support programs, unemployment rates, occupation, or other social factors, matter. Research shows that differences at a state-level matter, for example in access to firearms (whether because of differences in state laws or culture),13David M. Studdert et al., “Handgun Ownership and Suicide in California,” New England Journal of Medicine 382, no. 23 (June 4, 2020): 2220–29, https://bit.ly/3iWzLYN; Michael D. Anestis et al., “The Association Between State Laws Regulating Handgun Ownership and Statewide Suicide Rates,” American Journal of Public Health 105, no. 10 (October 2015): 2059–67, https://bit.ly/2H3KbHJ; Matthew Miller et al., “Household Firearm Ownership and Rates of Suicide Across the 50 United States,” The Journal of Trauma: Injury, Infection, and Critical Care 62, no. 4 (April 2007): 1029–35, https://bit.ly/2FGQUqP; Terry L. Schell et al., “State-Level Estimates of Household Firearm Ownership,” (RAND Corporation, April 22, 2020), https://bit.ly/2KDHV8R. access to health care and mental health care services,14Stephanie Brooks Holliday, “The Relationship Between Mental Health Care Access and Suicide,” (RAND Corporation, March 2, 2018), accessed July 29, 2020, https://bit.ly/2FJokop. socio-economic differences, and economic assistance.15 Allison Milner et al., “Social-Environmental Factors and Suicide Mortality: A Narrative Review of over 200 Articles,” Sociology Mind 3, no. 2 (April 25, 2013): 137–48, https://bit.ly/2RKJNjn; Allison Milner, Andrew Page, and Anthony D. LaMontagne, “Long-Term Unemployment and Suicide: A Systematic Review and Meta-Analysis,” PLOS ONE 8, no. 1 (2013), https://bit.ly/3iVmAHa; Jonathan Cylus, M. Maria Glymour, and Mauricio Avendano, “Do Generous Unemployment Benefit Programs Reduce Suicide Rates? A State Fixed-Effect Analysis Covering 1968–2008,” American Journal of Epidemiology 180, no. 1 (2014): 45–52, https://bit.ly/2EduiNU. It also assumes that the difference in congressional district borders by sex and race, where parts of a county were allocated to one or a different congressional district, are more significant than differences across congressional borders because of the county-level age structure.
Another simplifying assumption made was that five-year totals and averages could be used despite an increasing trend in firearm suicides over the period. Additionally, the deaths and rates are allocated to current (116th) Congress even though the deaths occurred during the 113th (2013–2014) to the 115th (2017–2018) Congresses. The Census uses 2010 population counts for its congressional district summary files, so while the census tracts are assigned according to their 2018 county and congressional district borders, the population demographics may have changed from their 2010 relative levels.
Of the 428 districts analyzed (excluding the known at-large districts), 263 congressional districts included at least one county that was wholly within the geographic boundaries of the district. This means that deaths reported for these counties were wholly included in the congressional district totals, limiting the number of deaths that had to be apportioned partially because of county and congressional district borders crossing.
As a validation, estimated firearm suicide deaths across congressional districts within a state were then summed together and checked against CDC state totals. On average across states, the total of congressional districts within the state was 99.5 percent of the CDC state-level counts for firearm suicide. This ranged from Nebraska (95.5 percent) to Mississippi (102.2 percent), meaning that the firearm deaths for congressional districts in Nebraska are an underestimate of the total for the state by 4.5 percent and those in Mississippi are an overestimate by 2.2 percent. As expected, the states with the largest under and over counts were those with higher proportions of counties with suppressed county-level deaths. The validation was repeated for all suicides, and because of higher counts and fewer counties with suppressed data, the range was from a low of 99.2 percent of all suicides (Virginia) to a high of 103.75 percent (Mississippi).
The value of having an understanding of the relative burden of firearm suicide by congressional district outweighs the limitations of these estimates. As explained further in the report on the results of this analysis, access to data on firearm suicides in a congressional district can help voters and elected representatives pinpoint the scope and location of the problem, help identify underlying factors present in different places, and point to the types of legislation and programs that can address this public health crisis in each district. The importance of presenting mortality by congressional district is not unique to violent firearm deaths;16Analysis of congressional district mortality has similarly been calculated for many other causes of death including cancer, coronavirus, opioid use, and multiple causes of mortality. therefore, the CDC would ideally add congressional district data from the National Vital Statistics System to its public reporting. Short of this, additional validation of these congressional estimates could be done with more detailed datasets that currently have restricted availability such as the National Violent Death Reporting System.
LEARN ABOUT FIREARM SUICIDE IN YOUR CONGRESSIONAL DISTRICT
Everytown Research & Policy is a program of Everytown for Gun Safety Support Fund, an independent, non-partisan organization dedicated to understanding and reducing gun violence. Everytown Research & Policy works to do so by conducting methodologically rigorous research, supporting evidence-based policies, and communicating this knowledge to the American public.