A More Complete Picture
The Contours of Gun Injury in the United States
Last Updated: 11.2.2021
Executive Summary
Nonfatal gunshot wounds account for an enormous portion of the gun violence epidemic in America but they have not been an integral part of the conversation. This is, in part, because there is no centralized system for tracking nonfatal firearm injuries and no place to look up the number, type, and location of these injuries as a basis to analyze the data and use it to shape effective responses. Everytown has filled this critical gap with data and analysis using several federal datasets that are not readily available to the public.
Key Findings
- Daily Impact: Every day in America, more than 200 people sustain a nonfatal gun injury.
- Intent: More than 60 in 100 gun deaths each year are by suicide, while just three in 100 hospital visits each year due to a gunshot wound are the result of a suicide attempt. This strongly reaffirms existing research on the lethality of firearms.
- Sex: 87 percent of those who visit a hospital for a gunshot wound are male, mostly adolescents and young adults.
- Age: Adolescents and young adults, starting at age 15 and peaking in the early 20s, are at highest risk of gun injury.
- Race and Ethnicity: Black people, with a rate of 113.8 nonfatal injuries per 100,000 people, have the highest rate of nonfatal gun injuries over 10 times higher than white people. The Latino/a rate of nonfatal gun injuries is double that of white people.
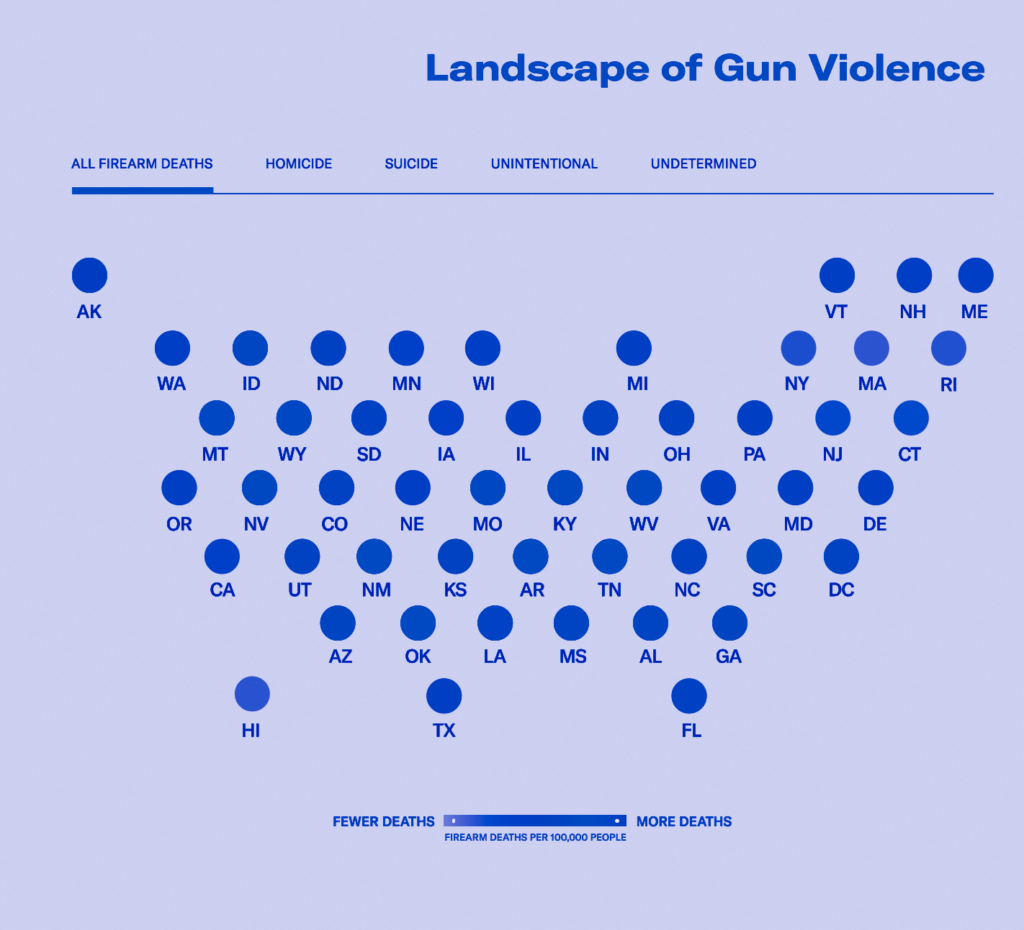
- State: Rates of nonfatal firearm injury vary tremendously, from states with a rate above 60 persons injured per 100,000 people (including Alabama, Washington, DC, Louisiana, and Mississippi) to rates below 10 (as in Colorado, Hawaii, Maine, and New Hampshire).
This analysis concludes with a set of actions that rigorous research shows could contribute to greatly reducing the unacceptable daily toll of nonfatal gun injuries. These actions range from the collection and dissemination of data, to local violence intervention programs that interrupt cycles of violence, to secure gun storage practices by individuals, to policies that limit the easy acquisition of firearms that contributes to both fatal and nonfatal gun injuries.
Perhaps the most urgent reason to understand nonfatal gun injuries is because one of the strongest predictors of future violence for young people is surviving it. The risk that a young person who has been to the hospital for a firearm assault will be involved with future firearm violence is extremely high. Taking action to disrupt cycles of victimization, retaliation, and retribution guarantees a more productive and fulfilling life for tens of thousands of young Americans and is an essential step toward building safer communities.
“When I was shot, it changed my life—and the lives of everyone in my family—completely. We’ll live the consequences for the rest of our lives, as will the families of other survivors, a group that grows by hundreds every single day. As survivors, our stories are all different, but together, they show how urgently we need action to prevent gun violence.”
Karina Sartiaguin was the unintended target of a 2010 drive-by shooting outside of her school, Central High School, in Aurora, Colorado.
Introduction
The story of gun violence in the United States is often told through the tragic deaths that come with numbing regularity—on average more than 100 gun deaths occur each day.1Centers for Disease Control and Prevention (CDC), National Center for Health Statistics, Wide-ranging Online Data for Epidemiologic Research (WONDER), Underlying Cause of Death. A yearly average was developed using five years of most recent available data: 2014 to 2018. But an often overlooked part of today’s gun violence crisis is nonfatal gun injuries, which occur with disturbing frequency and outnumber gun deaths.
200+
Every day in America, more than 200 people sustain a nonfatal gun injury.
Every day in the United States, more than 200 people sustain a nonfatal gun injury.2The data that forms the basis of this report, unless otherwise indicated, comes from the Nationwide Emergency Department Sample (NEDS) and the National Inpatient Sample (NIS), both part of the Healthcare Cost and Utilization Project (HCUP) of the US Department of Health & Human Services’ Agency for Healthcare Research and Quality (AHRQ). Data is from 2017, the most recent year available for this data. These survivors are overwhelmingly adolescent and young adult males, too many of whom endure life-long physical and emotional complications as a result that limit their opportunities far into adulthood. Perhaps one of the most pernicious impacts of this daily injury toll is the way it contributes to a vicious cycle of violence: One of the strongest predictors of future violence for young people is surviving it.3Jennifer N. Shaffer and R. Barry Ruback, “Violent Victimization as a Risk Factor for Violent Offending among Juveniles,” Juvenile Justice Bulletin (Office of Juvenile Justice and Delinquency Prevention, December 2002), https://bit.ly/32j52yu; Simon I. Singer, “Homogeneous Victim-Offender Populations: A Review and Some Research Implications,” Journal of Criminal Law and Criminology 72, no. 2 (1981): 779–88; Wesley G. Jennings, Alex R. Piquero, and Jennifer M. Reingle, “On the Overlap between Victimization and Offending: A Review of the Literature,” Aggression and Violent Behavior 17, no. 1 (2012): 16–26, https://doi.org/10.1016/j.avb.2011.09.003; Robert J. Sampson and Janet L. Lauritsen, “Violent Victimization and Offending: Individual-, Situational-, and Community-Level Risk Factors,” in Understanding and Preventing Violence, Volume 3: Social Influences, ed. Albert J. Reiss and Jeffrey A. Roth (National Academies Press, 1994).
Understanding the contours of these injuries—where, to whom, and how often they occur—is essential for developing solutions. Yet there is no centralized system for tracking nonfatal firearm injuries and no place to look up the number, type, and extent of these injuries.4The CDC, the federal agency responsible for collecting data to protect the US from dangerous health threats, hasmade nonfatal firearm injury data available through its National Electronic Injury Surveillance System (NEISS) dataset in the past. However, in the face of increasing scrutiny of the reliability of this data, the CDC removed 2016 and 2017 nonfatal injury data and has not published 2018 data for firearms on its website. Everytown for Gun Safety strongly supports equipping the CDC with the funds necessary to thoroughly measure and examine gun violence. While emergency department and inpatient data on gunshot wounds is systematically collected by a hospital’s billing department, it is not currently made publicly available. Some states provide data for free through the federal Healthcare Cost and Utilization Project’s database (HCUPnet), but in others, such data comes with a high price tag and a two- or three-year delay. The result is that the ongoing epidemic of nonfatal gunshot wounds is not an integral part of the conversation around gun violence in America. The pain, the emotional trauma, and the long-term consequences for those who are treated and survive gunshot wounds are hardly counted.
1/4
Nearly one-fourth of the individuals surviving a nonfatal gun assault at age 24 or younger will be shot again at least once within the next 10 years.
William Aaron Marshall et al., “Recidivism Rates Following Firearm Injury as Determined by a Collaborative Hospital and Law Enforcement Database,” Journal of Trauma and Acute Care Surgery 89, no. 2 (August 2020): 371–76, https://doi.org/10.1097/TA.0000000000002746.
Why is data on this topic essential? Having comprehensive information about nonfatal gun injuries is vital for doctors, emergency medical technicians, police departments, and trauma hospitals to plan for future needs. It is critical for accurately estimating the economic burden of gun injuries on taxpayers and survivors, with costs that may extend years beyond the initial physical wound. And it could provide important signals for understanding trends in the criminal use of firearms. Perhaps the most urgent reason to understand these injuries is to disrupt cycles of victimization, retaliation, and retribution, particularly among young males. The risk of young people who have been to the hospital for a firearm injury becoming involved with future violence, as victim or victimizer, is very high. One study estimated that nearly one-fourth of the individuals surviving a nonfatal gun assault at age 24 or younger will be shot again at least once within the next 10 years.5William Aaron Marshall et al., “Recidivism Rates Following Firearm Injury as Determined by a Collaborative Hospital and Law Enforcement Database,” Journal of Trauma and Acute Care Surgery 89, no. 2 (August 2020): 371–76, https://doi.org/10.1097/TA.0000000000002746.
In an effort to fill this critical information gap, Everytown Research analyzed the federal Healthcare Cost and Utilization Project (HCUP) dataset for 2017, the most recent year available, to calculate nonfatal firearm injuries for different intents (assault, self-harm, etc.) by age, sex, race/ethnicity, state, urbanicity, and more. The data in this paper is derived from analysis of two HCUP datasets: the Nationwide Emergency Department Sample (NEDS) and the National (Nationwide) Inpatient Sample (NIS). To estimate these injury totals on the state-level, we worked with David I. Swedler, Ted R. Miller, and other researchers at the Pacific Institute for Research and Evaluation (PIRE). Full details can be found in the Methodological Note.
Learn more on EveryStat
National Findings
An estimated 84,776 people—more than 200 people each day—were shot and wounded by firearms in the US in 2017, the most recent year for which data is available.6HCUP data is from 2017. In 2017, according to the CDC WONDER, Underlying Cause of Death, there were 39,773 gun deaths. This is more than double the daily gun deaths.7CDC WONDER, Underlying Cause of Death. And there’s no slow season for gunshot wounds. While nonfatal injuries occur most frequently in July and October, they are a constant, everyday burden on survivors, our medical system, taxpayers, and our communities.8HCUP, 2017.
Within this national estimate are variations that provide critical information for understanding the groups and places most vulnerable to gun violence:
Intent
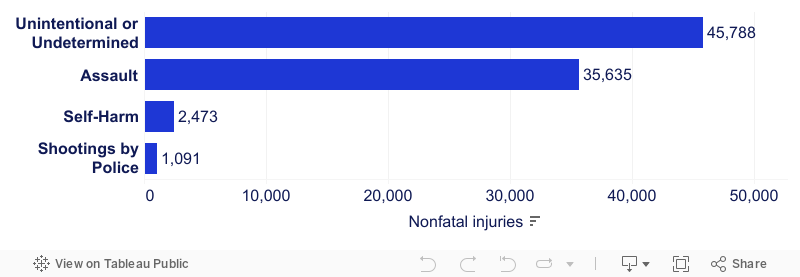
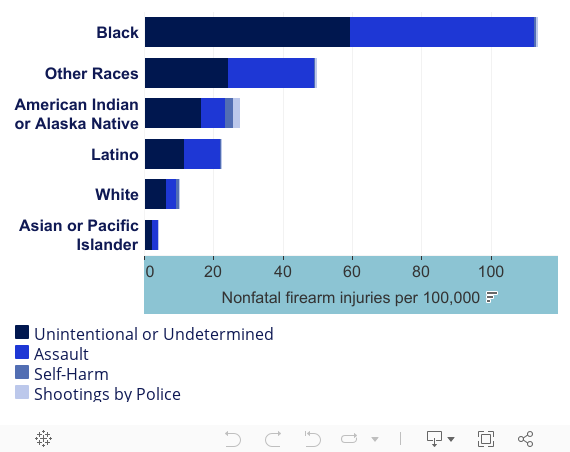
Assaults make up roughly 40 percent of nonfatal gun injuries, while suicide attempts make up 3 percent and shootings by police make up 1 percent of total nonfatal injuries. The rest are categorized as unintentional or undetermined.9A major drawback of the HCUP dataset is that incidents that may in fact be due to a gun assault often get categorized at the hospital as unintentional. This is because medical coders often mark the cause of injury as unintentional when the intent of a shooting is unclear and there is no affirmative documentation on the incident. For example, if the intents behind firearm injuries as reported in the CDC’s NEISS dataset from the most recent available years (2014 to 2016) were applied to HCUP, assaults would have been the most frequent cause of nonfatal firearm injury, accounting for 69.2 percent of injuries (58,705) compared to 26.6 percent of injuries (22,552) that were unintentional or of undetermined intent. Hospitals code nonfatal firearm injuries by intent into five basic categories: assault, self-harm (from an attempted suicide), shootings by police, unintentional shootings, and undetermined intents (see Figure 1). Because of small numbers and some discontinuity in hospital coding, the latter two categories are combined in this analysis.
Figure 1. Nonfatal Firearm Injury Categories
Last updated: 11.2.2021
Geographic region
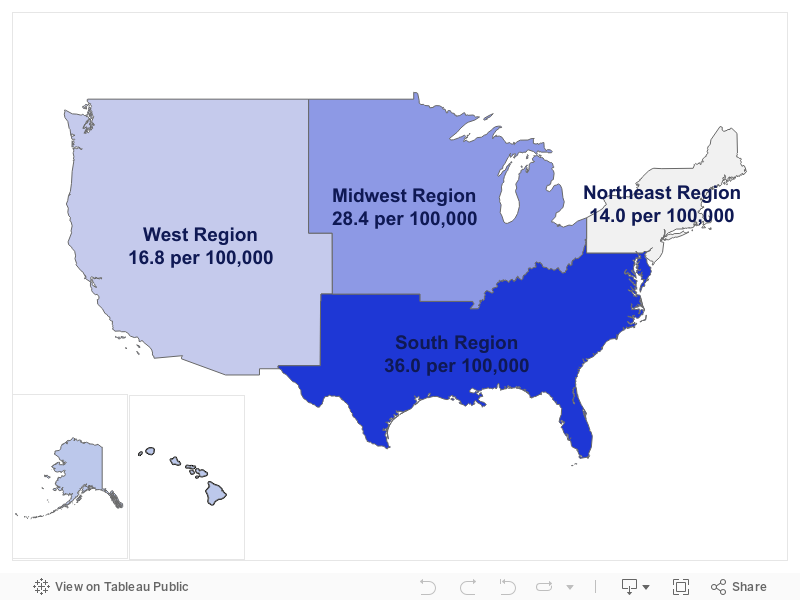
There are considerable differences among the four census regions (Northeast, Midwest, South, and West). When comparing the rate of nonfatal firearm injuries per 100,000 people to take into account the different population size of these regions, the 16 states of the American South combined were found to have a rate of injury twice that of the Northeast and of the West.
Map 1. Nonfatal Firearm Injuries are Highest in the South
Last updated: 12.20.2022
Sex
The overwhelming majority, 87 percent, of those who visit a hospital for a gunshot wound are male, mostly adolescents and young adults. In 2017, 10,850 females visited a hospital or were admitted for nonfatal gunshot wounds; for males, this number was 73,877.
Age
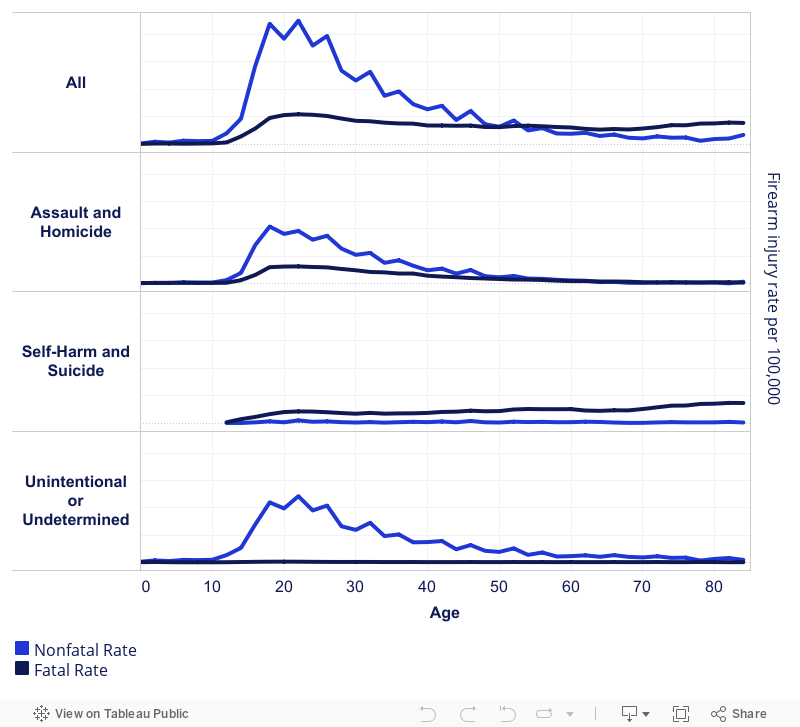
Adolescents and young adults are at highest risk of both gun death and injury. As Figure 2 shows, the risk among youth is far more elevated in the case of injuries than deaths. The risk of sustaining a nonfatal gunshot wound dramatically increases at age 15 and peaks in young adulthood. Though making up just a small slice of the US population, 15- to 24-year-olds nevertheless comprise 37 percent of all hospital-treated gunshot wound victims. A combination of risk factors for violence—including still-developing adolescent brains that can result in poor decision-making, the socialization of boys to a definition of masculinity that emphasizes aggressivity and toughness, the lionizing of guns in popular culture, and a lack of opportunity for youth that can result in a lack of structure and meaning in daily life and means for a livelihood—all increase the susceptibility of young people, particularly young males, to involvement with guns.10Office of the Surgeon General et al., “Risk Factors for Youth Violence,” in Youth Violence: A Report of the Surgeon General (Rockville, MD: Office of the Surgeon General, 2001), https://bit.ly/3pnuflc. In addition to these factors, weaknesses in gun laws make it too easy for young adults to procure a gun. Studies of juvenile offenders show that few obtained firearms through a licensed dealer; but they found few obstacles to alternative means, whether obtaining guns from a family member, friend, on the street or through other illegal methods.11Daniel W. Webster et al., “How Delinquent Youths Acquire Guns: Initial Versus Most Recent Gun Acquisitions,” Journal of Urban Health 79, no. 1 (2002): 60–69. In addition, an estimated 6.7 million American children live in households with at least one unlocked and loaded firearm.12Matthew Miller et al., “Firearm Storage in Households With Children,” JAMA Network Open 9, no. 5 (2026): e2612191, https://doi.org/10.1001/jamanetworkopen.2026.12191. These risk factors plus easy access to firearms combine to exact a heavy toll on America’s teenagers and young adults.
Self-harm is the only one of the major intents being studied in which the rate of nonfatal injuries from firearms is lower than that of fatalities. The self-harm category is also an exception in terms of the age groups most affected. In contrast to the other intents, the rate of nonfatal self-harm, or suicide attempts, remains uniformly low across all age groups. In the case of suicide death, the rate largely increases with age and rises considerably starting at age 65. Firearm deaths among older adults are overwhelmingly due to suicide.13CDC WONDER, Underlying Cause of Death. The reason for these exceptions is discussed further below.
Figure 2. Nonfatal Gunshot Wounds Peak in Young Adulthood
Last updated: 12.7.2022
Race and ethnicity
Rates of nonfatal gun injury victims among hospital inpatients vary widely by race and ethnicity (see Figure 3). Black people, with a rate of 113.8 nonfatal injuries per 100,000 people, have the highest rate of nonfatal gun injuries over 10 times higher than white people. The Latino/a rate of nonfatal gun injuries is double that of white people.14Data for all racial groups (Asian or Pacific Islander, Black, Native American, white) pertain to non-Latino or non-Hispanic members of those groups. Factors contributing to these disparities are discussed below.
Figure 3. Nonfatal Firearm Injury Rates are Highest among Black People
As is evident from this analysis, the overall distribution of gun injuries by demographic group is extremely uneven. The impact falls hardest on young males, particularly on young Black males. But the distribution of those who receive hospital care and survive also varies tremendously by intent, with implications for prevention efforts that can save lives.
Gun suicide attempts
60/100
More than 60 in 100 gun deaths each year are by suicides.
CDC WONDER, Underlying Cause of Death.
3/100
Three in 100 gunshot wounds each year are from a suicide attempt.
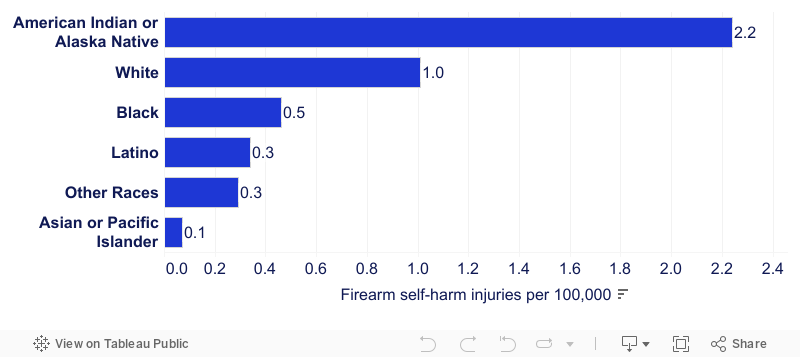
Just over 60 in 100 gun deaths each year are by suicide, yet three in 100 hospital visits for gunshot wounds each year are the result of a suicide attempt.15CDC WONDER, Underlying Cause of Death. Why? Because of the lethal nature of a gun. This analysis reaffirms earlier research showing that only 4 percent of suicide attempts using means other than a gun are fatal, whereas approximately 90 percent of suicide attempts using a gun result in death.16Andrew Conner, Deborah Azrael, and Matthew Miller, “Suicide Case-Fatality Rates in the United States, 2007 to 2014: A Nationwide Population-Based Study,” Annals of Internal Medicine 171, no. 12 (2019): 885–95, https://doi.org/10.7326/M19-1324. Contrary to the common misperception that suicide is inevitable and that suicidal ideation is a permanent condition, the vast majority of those who survive a suicide attempt do not go on to die from a subsequent attempt.17David Owens, Judith Horrocks, and Allan House, “Fatal and Non-Fatal Repetition of Self-Harm: Systematic Review,” British Journal of Psychiatry 181, no. 3 (2002): 193–99, https://doi.org/10.1192/bjp.181.3.193. Access to a firearm can be the difference between life and death in a time of crisis.
Figure 4. Firearm Suicide Attempts are Highest among Native American People
Nonfatal gun assault
In 2017, roughly four in 10 gunshot-related hospital visits were related to an assault—an estimated 35,635 people were wounded by a firearm assault and survived. This represents just under 100 people a day who survive a gunshot wound from an assault. This is likely a significant undercount as many hospital visits for gunshot wounds that were coded as unintentional or of undetermined intent may have actually been assaults.18Using the most recent years of nonfatal firearm injury data from the CDC’s NEISS as a comparator, HCUP may be undercounting firearm assault injuries by 64 percent, meaning that there may have been 58,705 assault injuries in 2017 or 161 persons each day who are shot and survive. For most of these survivors, the long-term repercussions do not end when they leave the hospital. The road to recovery can be long, the financial costs can be high, and the psychological and emotional toll can be debilitating, even for minor injuries.19Sarabeth A. Spitzer et al., “Costs and Financial Burden of Initial Hospitalizations for Firearm Injuries in the United States, 2006–2014,” American Journal of Public Health 107, no. 5 (May 2017): 770–74, https://doi.org/10.2105/AJPH.2017.303684.; Michael A. Vella et al., “Long-Term Functional, Psychological, Emotional, and Social Outcomes in Survivors of Firearm Injuries,” JAMA Surgery 155, no.1 (2020): 51–59, https://doi.org/10.1001/jamasurg.2019.4533.
87%
87% of those who visit a hospital for a gun assault wound are men or boys.
The overwhelming majority, 87 percent, of those who visit a hospital for a gun assault wound are male. Most are teens and young adults. The risk of gun assault injury dramatically increases at age 15 and peaks between the ages of 20 to 24 (see Figure 2 above).
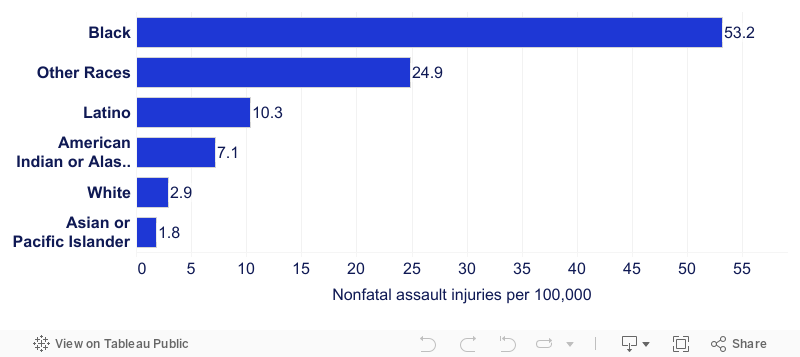
Further narrowing down populations most vulnerable to gunshot wounds, a disproportionate number of young males admitted as inpatients are Black. Black Americans experience a rate of nonfatal injury from assault that is five times the rate for Latino/a people, the next highest racial/ethnic group, and nearly 30 times higher than Asian and Pacific Islander people (see Figure 5).20The NEDS dataset does not include information on race, but the NIS dataset does. We have assumed that the race/ethnicity of patients is similar across both NEDS and NIS datasets.
Figure 5. Assault-Related Firearm Injury Rates Vary Widely by Race
Black communities have long experienced the disproportionate impact of gun violence, including homicides, nonfatal shootings, and general exposure to gun violence. This occurs more in cities and is largely driven by generations of systemic and structural racial discrimination, including housing policies resulting in extreme segregation by race, health care and education inequities, and exposure to environmental hazards such as lead as a result of unequal investments in critical services.21National Academies of Sciences, Engineering, and Medicine et al., The Root Causes of Health Inequity, ed. James N. Weinstein et al., Communities in Action: Pathways to Health Equity (National Academies Press (US), 2017), https://www.ncbi.nlm.nih.gov/books/NBK425845/. Loss and trauma from gun violence reflect and intensify this country’s long-standing racial inequities. This is evidenced today by the COVID-19 pandemic, another public health crisis in which these same factors have made Black and brown communities vulnerable to the devastating and deadly effects of COVID-19, with skewed rates of both COVID-related hospitalization and death.
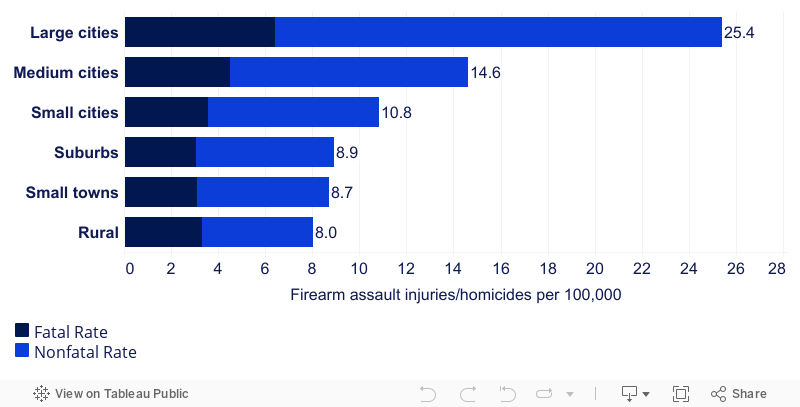
It is widely recognized that gun deaths from homicide disproportionately take place in cities, but the impact of gun violence on people in cities can be seen even more clearly in terms of nonfatal gunshot wounds. Roughly a third of the US population lives in large cities, yet over half (54 percent) of people who have survived a firearm assault live in them. The firearm assault rate in these large cities is nearly quadruple the rate in the two urbanization categories with the lowest population density: small towns and rural areas (see Figure 6).
Figure 6. Firearm Assault and Homicide Rates are Highest in Large Cities
One category of gun assault resulting in injuries is shootings of civilians by police, which led to 1,091 reported hospital discharges in 2017. Roughly nine in 10 of the wounded civilians were men.
Compared to other assault and self-harm injuries, the rate of nonfatal police shootings is more similar across urban and rural communities. However, survival rates differ significantly depending on rurality, perhaps because greater access to trauma centers and hospitals in urban areas may increase survival rates. More than half (51 percent) of those shot by police in rural areas die from their wounds, whereas in large cities, 29 percent do.
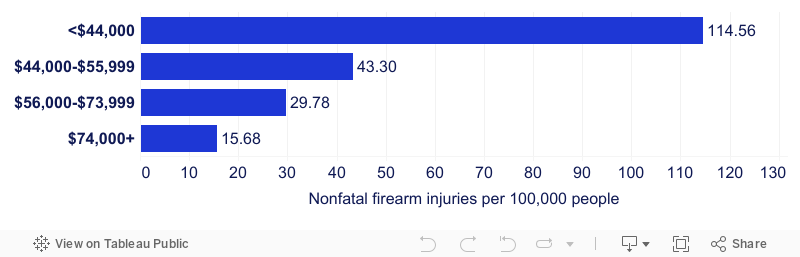
Finally, a further level of diagnosis can be obtained through analysis by income level. Dividing US zip codes into four equal groups based on household income, it is clear that the lower the typical (median) household income in a community, the higher the chance of gun assault injury. Individuals living in zip codes with a median household income at the bottom fourth of the income scale—less than $44,000 per year—account for six in 10 nonfatal firearm assault injuries. The rate of injuries among those living in these zip codes is nearly 9 times higher than among the population with median household incomes at the top fourth of the income scale—where incomes are $74,000 or more per year (see Figure 7).
In short, for those living in low-income areas, the likelihood of sustaining a gunshot wound is many times higher than for those living in higher-income neighborhoods.
Figure 7. Higher-Income Neighborhoods Have Fewer Nonfatal Firearm Injuries
Unintentional or undetermined gun injury
Just over half of the total annual nonfatal firearm injuries seen in hospitals were classified as either unintentional or undetermined (i.e., having no known intent). The majority of these (43,173) are unintentional injuries; only 3 percent (2,557) are undetermined. Similar to firearm assault, increased risk of unintentional and undetermined nonfatal injuries starts at age 15 and spikes sharply through adolescence, teenage years, and young adulthood (see Figure 2 above). Children are particularly impacted by unintentional gunshot wounds, both in terms of its physical and emotional toll, but also the likelihood they will be readmitted to a hospital and have a permanent disability.22Carla DiScala and Robert Sege, “Outcomes in Children and Young Adults Who Are Hospitalized for Firearms-Related Injuries,” Pediatrics 113, no. 5 (2004): 1306–12, https://doi.org/10.1542/peds.113.5.1306.
Unintentional firearm injuries among children peak in June and on weekends.
The timing of these injuries provide some clues to prevention. The month with the highest rate of unintentional firearm injuries among children 18 and under is June, and weekends are 1.5 times more dangerous for young people than weekdays.23The rate of nonfatal unintentional and undetermined gun injuries among children 18 years and under in June is 1.6 times higher than that in March (6.8 per 100,000 compared to 4.1 per 100,000). The rate for children on weekends is 7.6 per 100,000 children compared to 5.2 per 100,000 children during the week. The implications are clear that securely storing all firearms—locked, unloaded, and separate from ammunition—in every home is a guaranteed way to save young lives and avoid preventable tragedies.24David C. Grossman et al., “Gun Storage Practices and Risk of Youth Suicide and Unintentional Firearm Injuries,” JAMA 293, no. 6 (2005): 707–14, https://doi.org/10.1001/jama.293.6.707; Michael C. Monuteaux et al., “Association of Increased Safe Household Firearm Storage with Firearm Suicide and Unintentional Death Among US Youths,” JAMA Pediatrics 173, no. 7 (2019): 657–62, https://doi.org/10.1001/jamapediatrics.2019.1078.
State Findings
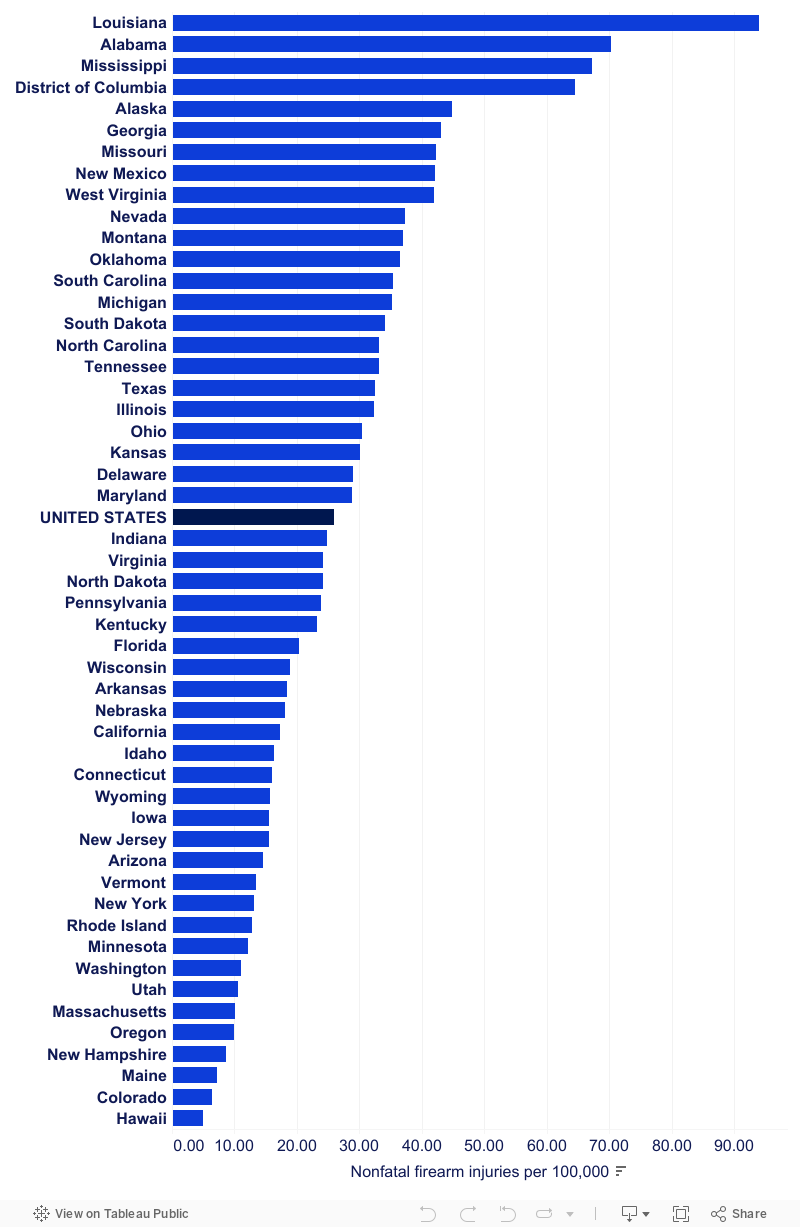
On average, there are 27.5 nonfatal firearm injuries per 100,000 people across all states. But this average hides enormous variation. Three states—Alabama, Louisiana, and Mississippi—and Washington, DC have rates above 60 per 100,000 people, while four others—Colorado, Hawaii, Maine, and New Hampshire—have rates below 10 per 100,000 people. Louisiana’s rate of 93.9 nonfatal injuries per 100,000 people is the highest among the 50 states and Washington, DC. It is also nearly 20 times that of Hawaii, which has the lowest rate at 5 nonfatal injuries per 100,000 people. If Louisiana had the same rate as Hawaii, 2,000 lives would have been spared the lifelong challenges of being a gun violence survivor.
Similar Population Sizes, Different Injury Outcomes
New Jersey
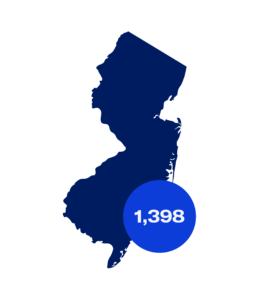
Population: 9,005,644
Nonfatal Injuries: 1,398
Georgia
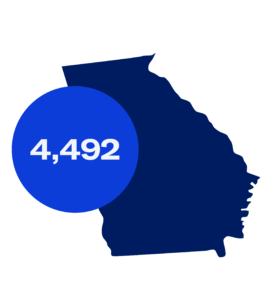
Population: 10,429,379
Nonfatal Injuries: 4,492
Further illustrating the huge range among states, New Jersey and Georgia, while having about equal-sized populations (roughly 10 million people), experience the suffering, cost, and long-term repercussions of nonfatal gun injuries very differently. New Jersey saw 1,398 lives upended by gunshot wounds; Georgia had more than triple that number, 4,492. Similarly, Rhode Island and Alaska, smaller states with similar population sizes (just over 1 million people), had very different gun injury outcomes: 135 in Rhode Island compared to 332 in Alaska.
While state-level data on nonfatal gun injuries is an important supplement to the more readily available data on gun deaths, more data at the local level (including city, county, neighborhood, block) is urgently needed to understand the problem, take action, and monitor whether solutions are moving the needle on the tragedy of gun violence in our communities.
Figure 8. Nonfatal Firearm Injury Rate by State
See data on nonfatal gun injuries in your state on EveryStat.
Recommendations
While the data used in this analysis is collected when a patient leaves the hospital, the impact of a nonfatal gun injury does not end there. Gun injuries can represent tremendous loss—the loss of a sense of safety, mental well-being, physical ability, income as a result of injuries that affect work, and the loss of innocence, particularly for the thousands of American children and young adults who are injured by guns.
We urgently need to count gun injuries—where they are happening, who is impacted, how often, and why—and use this information to shape programs and policies that will stop cycles of violence and build safer communities. We need to:
Collect and disseminate nonfatal firearm injury data
As the crisis of gun violence in this country continues, so must the nation’s investment in firearms data collection. A growing body of excellent research on the impact of gun violence prevention laws relies on gun death data. But the critical gap in data on nonfatal injuries hampers our ability to study the impact of programs and policies that could reduce these nonfatal incidents. While Everytown has endeavored to fill this gap, ultimately the federal government has an important role to play.
Several existing datasets, with additional support, could help to fill this need. The HCUP data that forms the basis of this report has many attributes: it is non-partisan, cost-effective since the data is already collected for individual hospital billing, and standardized using an international medical coding system. Everytown strongly supports the recommendation of the Expert Panel on Firearms Data Infrastructure for research funding and support for HCUP to resolve coding issues that result in misclassification of many firearm assaults and to make state datasets available annually in a timely release. A second, complementary option is to provide the Centers for Disease Control and Prevention (CDC) with the additional resources they have requested to fix shortcomings in their National Electronic Injury Surveillance System (NEISS). This funding would enable them to produce more reliable national nonfatal gun injury estimates.25Robert R. Redfield, “CDC Director Robert R. Redfield to US Senator Robert Menedez,” May 3, 2019, https://bit.ly/3eOGQZU. Finally, the Federal Bureau of Investigation’s Uniform Crime Reporting program, which includes the National Incident-Based Reporting System (NIBRS), collects data on crimes from local law enforcement and is another opportunity to use an existing dataset to better capture nonfatal firearm injuries.26Daniel Webster, “A Critical Gap in Gun Violence Data,” Bloomberg American Health Initiative (blog), accessed November 11, 2020, https://bit.ly/3kvAu37.
Invest in those at greatest risk through local intervention programs
Community-based violence intervention programs work to reduce gun violence in the hardest hit neighborhoods through a variety of strategies, including street outreach, hospital-based violence intervention programs, group violence intervention, crime prevention through environmental design, and safe passage programs. These locally driven, data-informed programs often identify individuals, particularly youth, who are at the highest risk of shooting or being shot, and support them by offering employment, mentorship, mental health, and other services and by helping to mediate conflicts in the community. These positive interventions address the risk factors that are shared by both victims and victimizers alike, thereby interrupting retaliation, providing options and opportunities, and disrupting deadly cycles of violence. Historic freezes on gun violence research and a related lack of available funding for community-based violence intervention programs has impacted the amount of solid research available. However, rigorous studies do exist, with some demonstrating promising to positive impacts. For example, in the case of hospital-based violence intervention programs, San Francisco’s Wraparound Project demonstrated a six-year violent reinjury rate of 4.9 percent (2005-2014), compared to a 8.4 percent historical control of violently injured patients prior to the program’s implementation (2000-2005).27Catherine Juillard et al., “A Decade of Hospital-Based Violence Intervention: Benefits and Shortcomings,” Journal of Trauma and Acute Care Surgery 81, no. 6 (2016): 1156–61, https://doi.org/10.1097/TA.0000000000001261 State and local governments should invest in these programs and take advantage of grants such as the Victims of Crime Act (VOCA) assistance funds to support and expand them.
Encourage secure gun storage practices
Firearms should always be stored securely—unloaded, locked, and separate from ammunition—to prevent gun deaths and injuries. Over the past five years, there has been an average of nearly one unintentional shooting by a child every day as a result of children gaining access to firearms and unintentionally shooting themselves or someone else. These tragedies are preventable and the more families know about the risks, the more likely behaviors will change. Secure firearm storage practices are associated with reductions in the risk of self-inflicted and unintentional firearm injuries among children and teens of up to 78 and 85 percent, respectively, depending on the type of storage practiced.28Grossman et al., “Gun Storage Practices and Risk.” Be SMART is one public education program designed to help parents and adults normalize conversations about gun safety in both homes and vehicles and to encourage secure firearm storage in their own homes, among their peers, and when children are visiting others.
Enact policies that reduce gun violence
Three gun safety policies in particular can help to limit the easy acquisition of firearms that contributes to nonfatal injuries.
- Background checks and permit to purchase laws ensure that a person attempting to buy a gun is not legally prohibited from having the gun. While current federal law requires background checks for gun sales by licensed gun dealers, it does not require checks for guns sold by unlicensed sellers, such as non-dealers selling online or at gun shows. The unlicensed marketplace is large: an Everytown investigation of Armslist.com, the nation’s largest online gun marketplace, found that there were 1.2 million ads for the sale of a firearm that would not be subject to a background check in 2018. Twenty-one states and Washington, DC, require background checks on all handgun sales.29CA, CO, CT, DE, HI, IL, MA, MI, MD, NE, NJ, NM, NY, NV, NC, OR, PA, RI, VT, VA, and WA. A 2015 study found that states with stronger state-level background check legislation have lower rates of nonfatal firearm injury.30Joseph A, Simonetti et al., “State Firearm Legislation and Nonfatal Firearm Injuries,” American Journal of Public Health 105, no. 8 (2015): 1703–9, doi:10.2105/AJPH.2015.302617.
- Secure storage laws are an effective tool to reduce both gun death and injury, particularly among children and teens. There is no federal law requiring secure storage by gun owners. However, 20 states and Washington, DC, have some form of law to hold individuals accountable when firearms fall into unauthorized hands due to a failure to store them securely.31CA, CT, DE, FL, HI, IA, IL, MA, MD, MN, NV, NY, NC, NH, NJ, RI, TX, VA, WA, and WI. One important subset of these laws, called child access prevention laws, impose criminal penalties on adults when a child gets unauthorized access to their firearms. A 2013 study found that these child access laws reduced self-harm gun injuries by 26 percent and reduced assaults, unintentional firearm injuries, and undetermined firearm injuries by 5 percent among children under 18 years old.32Jeffrey DeSimone, Sara Markowitz, and Jing Xu, “Child Access Prevention Laws and Nonfatal Gun Injuries,” Southern Economic Journal 80, no. 1 (July 1, 2013): 5–25, https://doi.org/10.4284/0038-4038-2011.333.
- Violent misdemeanor prohibitor laws, enacted in 13 states, keep guns out of the hands of people recently convicted of violent crimes.33AL, CA, CT, DE, HI, IL, ME, MA, MD, MN, NY, ND, and PA. While current federal law prohibits people convicted of felonies and misdemeanor domestic violence crimes from having guns, it does not bar offenders convicted of recent violent misdemeanor crimes (not exclusive to domestic violence), which could include offenses such as arson, sexual battery, strangulation, and assault and battery. State laws that prohibit people convicted of any violent misdemeanor are associated with an 18 percent reduction in homicide rates.34Siegel, Michael, Molly Pahn, Ziming Xuan, Eric Fleegler, and David Hemenway. “The Impact of State Firearm Laws on Homicide and Suicide Deaths in the USA, 1991–2016: A Panel Study.” Journal of General Internal Medicine 34, no. 10 (October 1, 2019): 2021–28. https://doi.org/10.1007/s11606-019-04922-x.
Everytown for Gun Safety would like to thank Daniel Webster of Johns Hopkins Bloomberg School of Public Health for his insightful review of the report.
Learn More:
Everytown Research & Policy is a program of Everytown for Gun Safety Support Fund, an independent, non-partisan organization dedicated to understanding and reducing gun violence. Everytown Research & Policy works to do so by conducting methodologically rigorous research, supporting evidence-based policies, and communicating this knowledge to the American public.