City Dashboard: Gun Homicide
Last Updated: 8.20.2025
Summary
Across the United States, gun homicides dropped by a record-setting -16.7 percent in 2024.1Everytown Research analysis of Federal Bureau of Investigation, “Expanded Homicide Data, Table 8: Murder Victims by Weapon, 2020–2024,” Crime Data Explorer, https://cde.ucr.cjis.gov/LATEST/webapp/#. By comparison, the number of gun homicide victims dropped 11.3 percent from 1995 to 1996. Everytown Research analysis of FBI SHR data, 1985–2024, accessed August 2025. https://ucr.fbi.gov/crime-in-the-u.s/. In effect, 2,352 fewer lives were taken by gun homicides in 2024, compared to 2023. Aggravated assaults involving guns, robberies involving guns, and overall violent crime fell along with it (-8.6 percent, -18.3 percent, and -4.5 percent, respectively).2Federal Bureau of Investigation, “UCR Summary of Reported Crimes in the Nation, 2024,” August 2025, https://cde.ucr.cjis.gov/LATEST/webapp/#/pages/explorer/crime/special-reports.
While this progress is worth celebrating, every life taken or forever changed due to gun violence is an avoidable tragedy. Factors like systemic racism, social determinants of health, and state-level gun safety policies contributed to some communities reaping these benefits more than others. In 2024, Black people in US cities died by gun homicides at a rate 5.5 times higher than white people.3 Everytown Research analysis of FBI NIBRS data, 2024, accessed August 2025. In FBI-reporting cities with populations of at least 65,000, Black people in the US died by gun homicides at a rate of 23.6 per 100,000 people, and white people died by gun homicides at a rate of 4.3 per 100,000 people in 2024.
The FBI is the leading source of city gun violence data, covering over 95 percent of the US population in 2024.4Federal Bureau of Investigation, “UCR Summary of Reported Crimes in the Nation, 2024,” August 2025, https://cde.ucr.cjis.gov/LATEST/webapp/#/pages/explorer/crime/special-reports. Everytown’s City Gun Homicide dashboard allows users to explore gun homicide trends in nearly 600 cities with populations of 65,000+ that reported data to the FBI from 2020 to 2024.
Key Takeaways
Across FBI-reporting cities with populations 65,000+:
- 62 percent of cities have now returned to pre-pandemic gun homicide rates.1Everytown Research analysis of FBI NIBRS data, 2024, accessed August 2025 and FBI SHR data, 2019, accessed June 2025. Of the 439 cities that reported data in both 2024 and 2019, 271 reported fewer or the same number of gun homicides in 2024 compared to 2019.
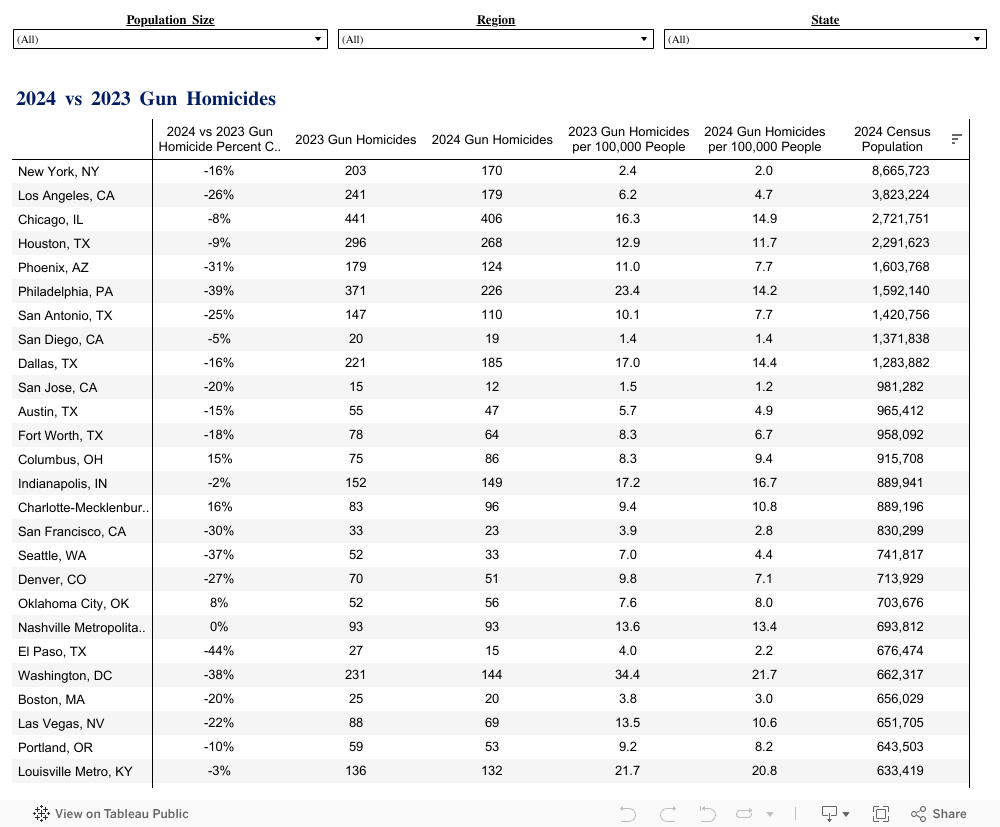
- All of the 10 largest cities experienced fewer gun homicides in 2024 than they did in 2023. These reductions were stark, saving more than 400 lives in these 10 cities alone.2Everytown Research analysis of FBI NIBRS data, 2023-2024, accessed August 2025. The 2023 to 2024 gun homicide count and percent change in the 10 largest cities with consistent reporting are: New York, NY (-33, -16 percent); Los Angeles, CA (-62, -26 percent); Chicago, IL (-35, -8 percent); Houston, TX (-28, -9 percent); Phoenix, AZ (-55, -31 percent); Philadelphia, PA (-145, -39 percent); San Antonio, TX (-37, -25 percent); San Diego, CA (-1, -5 percent); Dallas, TX (-36, -16 percent); and San Jose, CA (-3, -20 percent).
- Only 4 percent of cities reported gun homicide increases of 10 or more people in 2024.3Everytown Research analysis of FBI NIBRS data, 2023-2024, accessed August 2025. The 2023 to 2024 gun homicide count and percent change in cities with 10+ additional gun homicides in 2024 include: North Las Vegas, NV (+13, +93 percent); Charlotte, NC (+13, +16 percent); Columbus, OH (+11, +15 percent); Tucson, AZ (+10, +42 percent); Long Beach, CA (+10, +56 percent). Analysis restricted to cities with consistent reporting both years and had at least 10 gun homicides each year to account for unstable percent changes.
- Black and Latinx people in the US—two of the racial groups most disproportionately impacted by gun homicides across the country—experienced the sharpest declines in 2024 gun homicide rates (-15 percent and -17 percent, respectively).4Everytown Research analysis of FBI NIBRS data, 2023-2024, accessed August 2025. The 2023 and 2024 gun homicide rates per 100,000 and rate percent changes across racial groups are as follows: white people in the US (4.6 to 4.2, or -8 percent); Black people in the US (27.8 to 23.6, or -15 percent); Latinx (4.6 to 3.9, or -17 percent).
- City gun homicides decreased the most in the Northeast (-31 percent), followed by the West (-17 percent), the South (-14 percent), and the Midwest (-13 percent).5Everytown Research analysis of FBI NIBRS data, 2023-2024, accessed August 2025. Average 2024 gun homicide rates per 100,000 and 2023 to 2024 rate percent changes by region were: Midwest (9.8, -13 percent); Northeast (4.2, -13 percent); South (9.1, -14 percent); and West (4.0, -17 percent).
- Large-sized cities saw the sharpest gun homicide declines (-20 percent), but small cities continued to have the lowest rates.6Everytown Research analysis of FBI NIBRS data, 2023-2024, accessed August 2025. Average 2024 gun homicide rates per 100,000 and 2023 to 2024 rate percent changes by city population group were: 1,000,000+ (6.8, -20 percent); 500,000–999,999 (11.7, -16 percent); 250,000–499,999 (7.4, -4 percent); 100,000–249,999 (4.5, -19 percent); and 65,000–99,999 (3.3, -19 percent).
Gun Homicide Trends by City
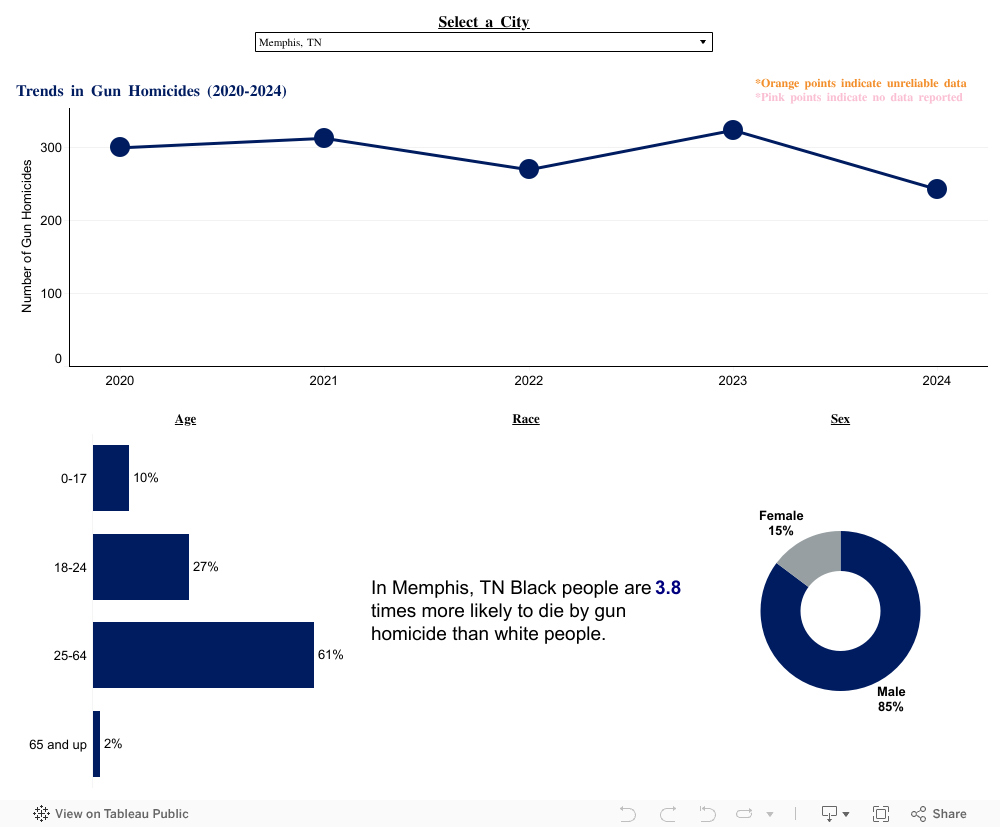
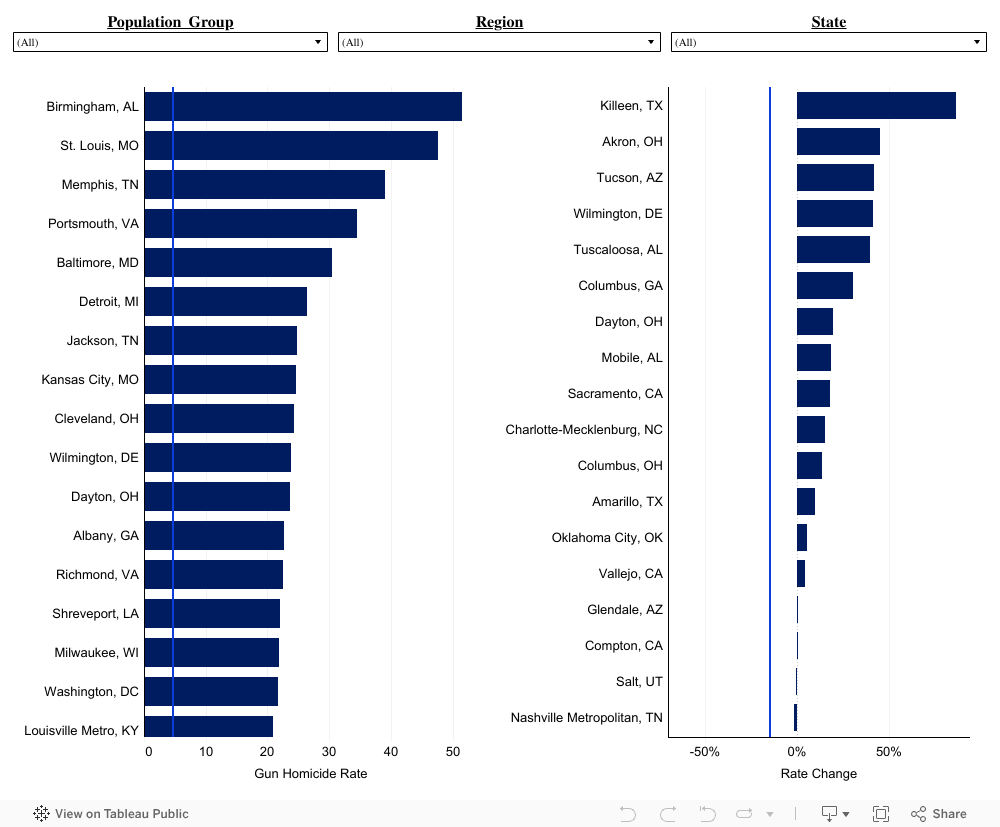
Compare Gun Homicide Across Cities
Data Tables: Gun Homicide
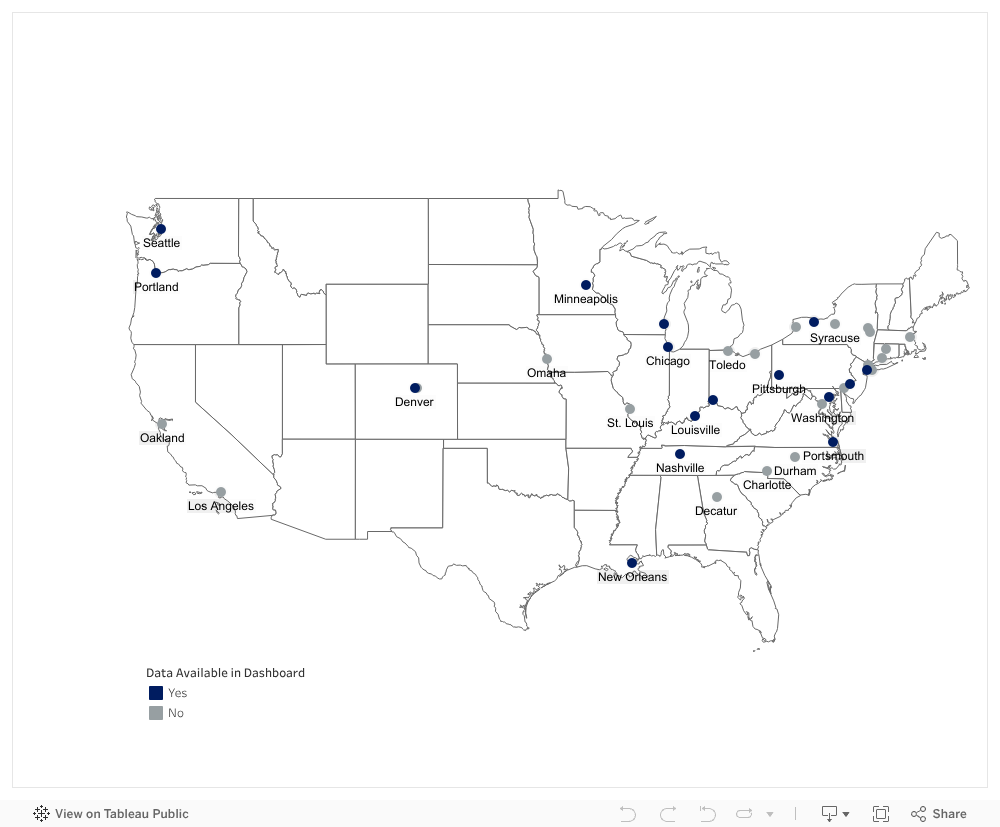
Cities with Real-Time Gun Violence Data
Methodology and Sources
Gun homicide data featured in this dashboard is drawn primarily from the FBI’s annual National Incident-Based Reporting System (NIBRS), and from the Supplementary Homicide Report (SHR) when NIBRS was unavailable. The FBI defines gun homicides as “murders, non-negligent manslaughters, killings of felons by law enforcement officers or private citizens, and negligent manslaughters.” Data was flagged as unreliable when FBI data notably differed from data reported directly by local law enforcement agencies.
All cities with populations of at least 65,000 and a law enforcement agency that reported 12 months of data per year to the FBI were included. Across the country, city definitions and geographic boundaries lack clarity and are often conflated with counties, metropolitan statistical areas, and more localized communities within them. This dashboard uses Census places to define city boundaries and populations and to allocate law enforcement agencies. For state- and county-level data, please see EveryStat.
Rates and percent changes are only calculated for cities with firearm homicide counts of 10 people and above. Averages are calculated based on the selected and displayed cities. Victim characteristic graphics are calculated using FBI five-year totals, and due to rounding, graphs may not add to 100 percent. If five years of data were not available for a city, the values were calculated using all available data. Visualizations with year-over-year changes only display cities that reported complete data in both the current and prior year.
Know a city that reports real-time gun violence data and isn’t featured in this dashboard? Email the link to [email protected].
Sources:
- FBI Supplementary Homicide Report, 2020–2024, (accessed August 2025), https://cde.ucr.cjis.gov/LATEST/webapp/#/pages/downloads.
- FBI National Incident-Based Reporting System, 2021–2024, (accessed August 2025), https://cde.ucr.cjis.gov/LATEST/webapp/#/pages/downloads.
- American Community Survey, 2019–2023, (accessed June 2025), https://www.census.gov/programs-surveys/acs. Population estimates for 2024 for each Census Designated Place were calculated using a linear regression model based on data from the last 5 years of available data (2019–2023).
Learn More:
Everytown Research & Policy is a program of Everytown for Gun Safety Support Fund, an independent, non-partisan organization dedicated to understanding and reducing gun violence. Everytown Research & Policy works to do so by conducting methodologically rigorous research, supporting evidence-based policies, and communicating this knowledge to the American public.